

Approximately 30 years ago J. Bond (Not James but John – “The Hazards of Life and All That”) introduced the three laws of loss prevention:
- He who ignores the past is condemned to repeat it.
- Success in preventing a loss is in anticipating the future.
- You are not in control if a loss has to occur before you measure it.
The message for cyber security seems to be that when we measure and quantify the degree of resilience that OT security provides or an installation requires, we learn something from that. When we measure, we can compare / benchmark, predict and encapsulate the lessons learned in the past in a model looking into the future. One way of doing this is by applying quantitative risk methods.
Assessing risk is done using various methods:
- We can use a qualitative method which will produce either a risk priority number or a value on an ordinal scale (high, low, ..) for the scenario (if scenarios are used, we discuss this later) for which the risk is estimated. The qualitative method is very common because it is easy to do, but often also results in a very subjective risk level. Never the less I know some large asset owners used such a method to assess cyber security risk for their refinery or chemical plant. Care must be taken that qualitative risk assessments don’t result in a form generic risk assessment, becoming more a risk awareness exercise than providing risk in terms of likelihood and consequence as a base for decision making.
- Another approach is to use a quantitative method, which will produce a quantitative threat event frequency, or probability value for an attack scenario analyzed and considers how risk reduction controls reduce the risk. Quantitative methods require more effort and are traditionally only used in critical situations, for example in cases where an incident can result in fatalities. This because regulatory authorities specify quantitative limits for both worker risk and societal risk for production processes. Today we have also computational methods developed that reduce the effort of risk estimation significantly. An advantage of a quantitative method is that a quantitative result expresses risk in terms of likelihood (event frequency or probability) and consequence and links these to the risk reduction the security measures offer. Providing a method of justification.
- A Generic risk assessment is an informal risk assessment, e.g. an asset owner and my employer wants me to consider the risk whenever I apply changes to an OT function. Generic risk is a high level process, considering what are the potential impacts of the modification, where can things go wrong, how do I recover if it goes wrong, who needs to be aware of the change and the potential impact? Most of us are very familiar with this way of accessing risk, for example when we cross a busy street we do this immediately. Also generic risk assessments are used by the industry, but they are informal and depend very much on the skills and experience of the assessor.
- Dynamic risk assessment is typically used in situations where risk continuously develops such as is the case for firemen during a rescue operation, or a security operations center might apply this method while handling a cyber attack trying to contain the attack.
If we need to estimate risk for loss events during the conceptual or design phase of an industrial facility, we estimate risk for potential consequences for human health, environment, and finance. In those cases a quantitative method is important because it justifies the selected (or ignored) security measures. A quantitative risk assessment for loss events is an extension of the plant’s process safety risk analysis, typically a process safety HAZOP normally followed by a LOPA.
In oil and gas, refining and the chemical industry it is quite normal that the HAZOP identifies hazards that can result in fatalities or significant financial loss. Just like there are loss scenarios identified that result in serious environmental impact. For hazards concerning human safety and environmental loss the governments have set limits, limits that set a limit on how often such an event may occur per annum.
These limits are used by process safety engineers for setting their design targets for each consequence rating (Target Mitigated Event Likelihood – TMEL) on which they base the selection of the safeguards that reduce the risk in order to meet the required TMEL. Such a risk estimation process is typically carried out in the Layers Of Protection Analysis (LOPA). LOPA is a high level risk estimation process that typically follows a HAZOP. The HAZOP follows a systematical method to identify all potential safety hazards with their causes and consequences. The LOPA is the step following a HAZOP analysis performing a high level risk analysis for estimating a mitigated event likelihood frequency of the most critical hazards, for example the hazards with a high consequence rating.
LOPA is a semi-quantitative method using a set of predefined event frequencies for specific accidents (e.g. pump failure, leaking seal, ..) and predefined values for the risk reduction that safeguards offer when mitigating such an event. For example a safety instrumented function with SIL 2 safety integrity level offers a risk reduction of factor 100, a SIL 3 safeguard would offer a factor 1000, and a process operator intervention a factor 10. The SIL values are a function of the reliability and test frequency of the safeguard. Based upon these factors a mitigated event likelihood is estimated, and this likelihood must meet the TMEL value. If this is not the case additional or alternative safeguards (controls) are added to meet the TMEL value. Loss events for industrial installations are assigned a consequence rating level, and for each rating level a TMEL has been defined. For example the highest consequence rating might have a TMEL of 1E-05 assigned, the one but highest 1E-04, etc.
For the law the cause of a consequence like a fatality or environmental spill is irrelevant, the production process must offer a likelihood level that meets the legal criteria whatever the cause. For example we might need to meet a TMEL of 1E-06 for a consequence involving multiple fatalities for a greenfield installation in Europe, or a maximum TMEL of 1E-05 for existing brown field installations. This means that if a cyber attack can cause a fatality / irreversible injury, or major environmental damage, the likelihood of such an event (so its event frequency) must meet the same TMEL as is valid for the safety accident. The law doesn’t give bonus points for the one (safety) being accidental, and the other (cyber security) being intentional. Risk must be reduced to the level specified. To estimate such an event likelihood frequency as result of a cyber attack requires a quantitative process. So far the introduction.
Let’s first look at loss events and how they can arise in a production facility like a chemical plant. For this I created the following overview picture for showing the relevant automation function blocks in a production process. It is a high level overview ignoring some shared critical support components such as a HVAC that can also cause loss events if it would fail, or various management systems (network, security, documentation, ..) that can be misused to get access to the OT functions. I also ignore the network segmentations for now, network segmentation is managing the exposure of the functions so important for estimating the likelihood but not for this loss event discussion.

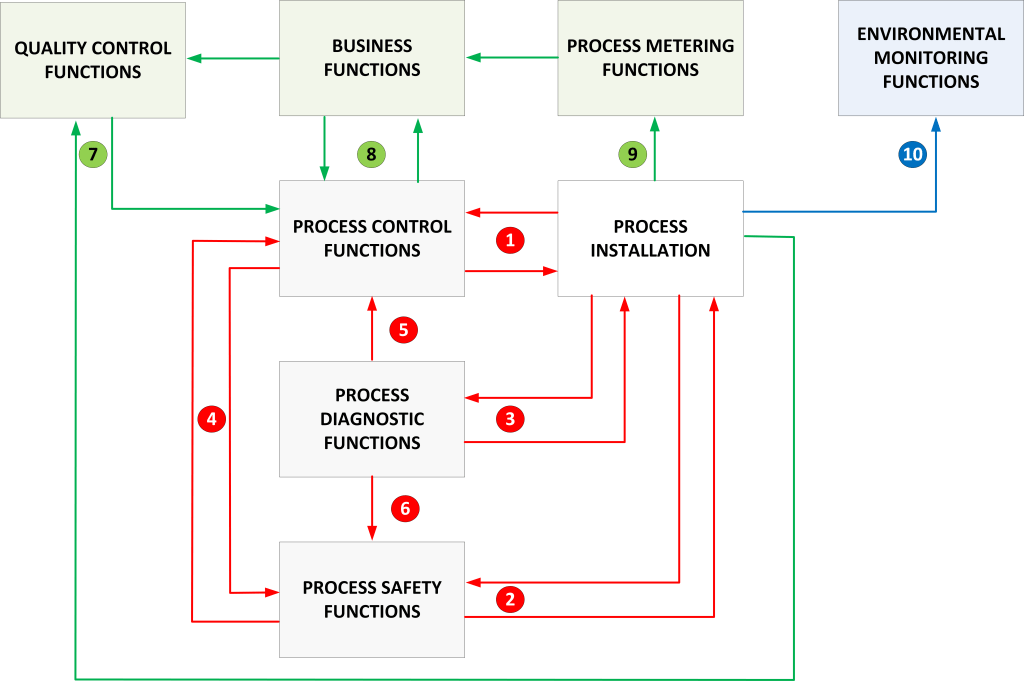
I start my explanation with discussing the blocks in the diagram.
- Process Control Functions – These are the collection of functions that control the production process, such as the basic process control system function (BPCS), the compressor control function (CCS), power management function (PMS), Advanced Process Control functions (APC), Motor Control Center function (MCC), Alarm Management function (ALMS), Instrument Asset Management function (IAMS), and several other functions depending on the type of plant. All specialized systems that execute a specific task in the control of a production process.
- Process Safety Functions – Examples of process safety functions are the Emergency Shutdown function (ESD), burner management function (BMS), fire and gas detection function (F&G), fire alarm panel function (FAP), and others. Where the control functions execute the production process, the safety function guards that the production process stays within safe process limits and intervenes with a partial or full shutdown if this is not the case.
- Process diagnostic functions – Examples of process diagnostic functions are machine monitoring systems (MMS) (e.g. vibration monitoring), and process analyzers (PA) (e.g. oxygen level monitoring). These functions can feed the process safety function with information that initiates a shutdown. For example the oxygen concentration in a liquid is measured by a process analyzer, if this concentration is too high an explosion might occur if not prevented by the safety function. Process analyzers are typically clustered in management systems that control their calibration and settings. These functions are network connected, similar as is the case for analyzers also HART, Profibus, or Foundation Fieldbus are network connected and can be attacked.
- Quality control functions – For example a Laboratory Information Management System (LIMS) keeps track of the lab results, is responsible for the sample management, instrument status, and several other tasks. Traditionally LIMS was a function that was isolated from the process automation functions, but nowadays there are also solutions that feed their data directly into the advanced process control (APC) function.
- Process metering functions – These are critical for custody transfer applications, monitoring of production rates, and in oil and gas installations monitor also well depletion. For liquids the function is a combination of a pump and precision metering equipment, however there are also power and gas metering systems.
- Environmental monitoring systems – These systems monitor for example the emission at a stack or discharges to surface water and groundwater. Failure can result in regulatory violations.
- Business functions – This is a large group of functions ranging from systems that estimate energy and material balances to enterprise resource planning (ERP) systems, tank management functions, and jetty operation and mooring load monitoring are considered in this category. This block contains a mixture of OT related functions and pure information technology systems (e.g. ERP), exchanging information with the automation functions. Business function is not the same as an IEC 62443 level 4 function, it is just a group of functions directly related with the production process and potentially causing a loss event when a cyber attack occurs. They have a more logistic and administrative function, but depending on the architecture can reside at level 3, level 4 or level 5.
- Process installation / process function – Least but not last the installation that creates the product. The pumps, generators, compressors, pipes, vessels, reactors, etc. For this discussion I consider valves and transmitters for a risk perspective to be elements of the control and safety functions.
The diagram shows numbered lines representing data and command flows between the function blocks. That doesn’t mean that this is the only critical data exchange that takes place, also within the blocks there are critical interactions between functions and their components that a risk assessment must consider. Such as for example the interaction between BPCS and APC, BPCS and CCS, BPCS and PMS, ESD and F&G. But also data exchange between the components of the main function, for example the information flow between an operator station and a controller in a BPCS, or the data flow between two safety controllers of a SIS. However that is at detailed level and mainly of importance when we analyze the technical attack scenarios. For determining the loss scenarios these details are of less relevance.
The diagram attempts to identify where we have direct loss (safety, environmental, financial) as result of the block functions failing to perform their task or performing their task in a way that does not meet the design and operational intentions of the function. Let’s look at the numbers and identify these losses:
- This process control function information / command flow can cause losses in all three categories (Safety, environmental, finance). In principle a malfunction of the control system shouldn’t be able to cause a fatality, the safety function should intervene in time, never the less scenarios exist that are out of control of the process safety function where an attack on the BPCS can cause a loss with a high consequence rating. These cyber attack scenarios exist for all three categories, but of course this also depends on the type and criticality of the production process and the characteristics of the process installation.
- Process safety functions have the task to intervene when process conditions are no longer under control by the process operator, however they can also be used to cause a loss event independent of the control function. A simple example would be to close a blocking valve (installed as a safety mechanism to isolate parts of the process) on the feed side of a pump, this would overheat and damage the pump if the pump wouldn’t be stopped. Also when we consider burner management for industrial furnaces multiple scenarios exist that can lead to serious damage or explosions if purge procedures would be manipulated. Therefore also the process safety function information/command flow can cause losses in all three categories (Safety, environmental, and finance).
- Process diagnostic functions can cause loss events by not providing accurate values, for example incorrect analyzer readings or incorrect vibration information. In the case of rotating equipment a vibration monitoring function can also cause a false trip of for example a compressor or generator. Also this diagnostic function data and command flow can cause losses in all three categories (Safety, environmental, finance), specifically cyber attacks on the process analyzer through their management system can have serious consequences including explosions with potentially multiple fatalities. Analyzers are in my opinion very much under-estimated as potential target, but manipulated analyzer data can result in serious consequences.
- The flow between the process control and process safety functions considers the exchange of information and commands between the control function and the process safety function. This would typically be alarm and status information from the process safety function and override commands coming from the process control function. Unauthorized override actions, or false override status information can lead to serious safety incidents. Just as loss SIL alarms can result in issues with the safety function not being noticed. In principle this flow can cause losses in all three categories (Safety, environmental, finance) though serious environmental damage is not likely.
- The flow between the diagnostic and control functions might cause the control function to operate outside normal process conditions because of for example manipulating process analyzer data. In principle this can cause both environmental and financial damage, but most likely (Assuming the process safety function is fully operational) no safety issues. So far I have never came across a scenario for this flow that scores in the highest safety or environmental category, but multiple examples exist for the highest financial category.
- The flow between the diagnostic and process safety functions is more critical than flow 5. This because flow 6 typically triggers the process safety function to intervene. If this information flow is manipulated or blocked, the process safety function might fail to act when demanded resulting in serious damage or explosions with losses in all three categories (Safety, environmental, finance).
- This information flow between the quality control function, the process installation, and the process function is exclusively critical for financial loss events. The loss event can be caused by manipulated quality information leading to off spec product either being produced or sold to customers of the asset owner.
- Manipulation of the information flow between the business functions and the control functions has primarily a financial impact. Though there are exceptions, for example there exist permit to work solutions (business function) that integrate with process operator status information. Manipulation of this data might potentially lead to safety accidents due to decisions based on incorrect status data.
- Manipulation of the information flow between metering functions and the business functions results primarily in financial damage. It normally has neither a safety or environmental impact. However the financial damage can be significant.
- The environmental monitoring function is an independent stand-alone function which loss is typically a financial loss event as result of not meeting environmental regulations. But minor environmental damage can be a consequence too.
Now we have looked at the loss events I like to change to the topic on how these loss events occur as result of a cyber attack on the automation functions. The diagram I created for this shows on the right side loss event categories, categories for process loss events and categories for business loss events. I don’t further discuss these in this blog, but these categories are used in the risk assessment reporting to group the risk of loss events allowing various comparison metrics showing differences between process installations. Primarily used for benchmarking, however this data gives an interesting view on the criticality of cyber attacks for different industries and the community.


The above graphic introduces which cyber security threats we analyze in a risk assessment and why. Threats are basically modelled as threat actors executing threat actions exploiting exposed vulnerabilities resulting in some unwanted consequence. We bundle threats in hazards, for example the hazard unauthorized access into a BPCS engineering HMI would be the grouping of all threats (attack scenarios) that can accomplish such unauthorized access. If the threat would succeed to accomplish this unauthorized access, a hazard would also have a series of consequences. These consequences are different depending on if we discuss the risk for the production process / installation or the risk for the business functions. Typically loss events for a process installation can be a safety, environmental, or financial loss event. While the impact on the business functions is typically financial loss.
Important to realize is that risk propagates, something that starts in the process installation can have serious impact for the business processes, but reverse is also true something that starts by a compromise of the business functions can lead to serious failures in the production installation. There for a risk assessment doesn’t separate IT and OT technology, it about functions and their mutual dependencies. This is why a criticality assessment (business impact) is an important instrument for identifying the risk domain for a risk analysis.
In a risk analysis we map the technical hazard consequences on the process and business loss scenarios. On the process / installation side there are basically two potential deviations: either the targeted function doesn’t perform anymore meeting design or operation intent; or the targeted function stops doing its task all together. These can result in process loss events. On the business side we have the traditional availability, confidentiality, and integrity impact. Data transfers can be lost, or their confidential content can get exposed, or the data can be manipulated all resulting in business loss events.
So the overall risk estimation process is identifying the scenarios (process and business), identify if they can be initiated by a cyber attack, if so then identify the functions that are the potential target and determine for these functions the cyber attack scenarios that lead to the desired functional deviations.
These attack scenarios are coming from a repository of attack scenarios for all the automation functions and their components in scope of the risk analysis. Doing this for multiple threat actors, multiple automation functions, and different solutions (having different architectures, using different protocols, having different dependencies between functions) for different vendors leads to a sizeable repository of cyber attacks with the potential security measures / barriers to counter these attacks.
In an automated risk assessment the technical architecture of the automation system is modelled in order to take the static and dynamic exposure of the targets (assets and protocols) into account, consider the exploitability of the targets, consider the intent, capabilities, and opportunity of the threat actors, and consider the risk reduction offered by the security measures. The result is what we call the threat event frequency, which is the same as what is called the mitigated event likelihood in the process safety context.
So far the attack scenarios considered are all single step attack scenarios against a targeted function. If the resulting mitigated event likelihood (MEL) meets the target mitigated event likelihood (TMEL) of the risk assessment criteria we are ready, the risk would meet the criteria. If not, we can add security measures to further reduce the mitigated event likelihood. In many cases this will reduce the MEL to the required level, if all functions are sufficiently resilient against a single step cyber attack than we can conclude the overall system is sufficiently resilient. However there are still cases where the TMEL is not met, even with all possible technical security measures implemented. In that case we need to extend the risk estimate by considering multi-step attack scenarios in the hope that this would reduce the overall probability of the cyber attack.
A multi-step attack scenario introduces significant challenges for a quantitative risk assessment. First we need to construct these multiple step attack scenarios, these can be learned from historical cyber attacks and otherwise using threat modelling techniques. Another complication is that in analyzing single step attack scenarios we used event frequencies, in multi-step attack scenarios this is no longer possible because we need to consider the conditional probability for the steps. The possibility of step B typically depends on the success of step A. So we need to convert the mitigated event frequencies of a specific single step into probabilities. This requires us to use a specific period, so calculate the probability for something like: “what is the probability that a threat with a mitigated event frequency of once every 10.000 years will occur in the coming 10 years”. Having a probability value we can add or multiply the probabilities in the estimation process. The chosen period for the probability conversion is not of much importance in this case because in the end we need to convert probability back into event frequency for comparison with the TMEL. Of more importance is if the conditional events are dependent or independent, this tells us to either multiply (independent) or add (dependent) probabilities which either increases or decreases likelihood.
For example if we have a process scenario that requires both to attack the control engineering function and the safety engineering function simultaneously, the result differs significantly if these functions require two independent cyber attacks or if a single cyber attack can accomplish both attack objectives. As would be the case if both engineering functions would reside in the same engineering station. This is why proper separation of the control and safety functions is also from a risk perspective very important. Mathematics and technical solutions go hand in hand.
So in a multi-step scenario we consider all steps of our attack scenario toward the ultimate target that creates the desired functional deviation impacting the production process. If these were all independent steps the conditional probability would have decreased compared with the single step estimate and as such also the likelihood if we convert the resulting conditional probability back into an event frequency (using the same period – e.g. the 10 years in my example). So far I never met a case where this wasn’t sufficient to be able to meet the TMEL. However it is essential to construct a multi-step scenario with the least amount of steps, otherwise we get an incorrect result because of too many steps between the threat actor and the target.
Never the less there is the theoretical possibility that in despite of considering all security measures available, in despite of considering the extra hurdles a multi-step attack poses, we still don’t meet the TMEL. In that case we have a few options:
One possibility is considering another risk strategy, so far we chose a risk mitigation strategy (trying to reduce risk using security measures). An alternative strategy can be a risk avoidance strategy, choosing for abandoning the concept all together or as alternative redesign the concept using another technical solution which potentially offers more or different options to mitigate the risk.
Risk strategies such as sharing risk (insurance) or spreading risk typically don’t work when it concerns non financial risk such as safety risk and environmental risk.
But as I mentioned so far I never encountered a situation where the TMEL could not be met with security measures, in the majority of the cases the compliance can be reached by analyzing single step scenarios for the targets. In some critical cases multi-step scenarios are required to estimate if risk reduction meets the criteria.
We might ask ourselves the question are we not overprotecting the assets if we attempt to solve mitigation by first establishing resilience against single step cyber attacks. This is certainly a consideration in the case where the insider attack can be ignored, but be aware that the privileged malicious insider typically can execute a single step attack scenario because of his / her presence within the system and having authorizations in the system. Offering sufficient protection against an insider attack most often requires procedures, non-technical means to control the risk. However so far there is no method developed that estimates the risk reduction of procedural controls for cyber security.
So what does a quantitative risk assessment offer? Well first of all a structural insight in a huge amount of attack scenarios, a growing amount of attack scenarios. It offers a way to justify investment in cyber security. It offers a method to show compliance with regulatory requirements for worker, societal, and environmental risk. And overall it offers consistency of the results and therefore a method for comparison.
What are the challenges, we need data for event frequencies. We need a method to estimate the risk reduction for a security measure. And we need knowledge, detailed knowledge on the infrastructure, the attack scenarios, process automation, a rare combination that only large and specialized service providers can offer.
The method does not provide actuarial risk, but it proofed in many projects to provide reliable and consistent risk. The data challenge is typically handled by decomposing the problem in smaller problems for which we can find reliable data. Experience and correction over time makes it time after time better. Actually in the same way as the semi quantitative LOPA method gained acceptance in the process safety world, the future for cyber risk analysis is in my opinion quantitative.
Strangely enough there are also many that disagree my statement, they consider (semi-)quantitative risk for cyber security as impossible. They often select as an alternative a qualitative or even a generic method, but both qualitative and generic methods are based on even less objective data. More subjective and not capable of proofing compliance to risk regulations. So the data argument is not very strong and has been concurred in many other risk disciplines. The complexity argument is correct, but that is time and education. Also LOPA was not immediately accepted, and LOPA as it is today is very structured and relatively simple to execute by subject matter experts. However we can also discuss data reliability for the LOPA method, comparing LOPA tables used by different asset owners also leads to surprises. Never the less LOPA has offered a tremendous value for a consistent and adequate process safety protection.
Process safety and cyber security differ very much but are also very similar. I believe cyber security must follow the lessons learned by process safety and adapt these for their own unique environment. This doesn’t happen very much resulting in weak standards such as for example the IEC 62443-3-2 ignoring what happens in the field.
There is no relationship between my opinions and references to publications in this blog and the views of my employer in whatever capacity. This blog is written based on my personal opinion and knowledge build up over 43 years of work in this industry. Approximately half of the time working in engineering these automation systems, and half of the time implementing their networks and securing them, and conducting cyber security risk assessments for process installations since 2012.
Author: Sinclair Koelemij
OTcybersecurity web site