Intelligent Field Device (IFD) security

For this blog, I’m focusing on a technical topic, one that’s been getting a lot of attention from the OT security community lately. There are subject matter experts like Joe Weiss who take every opportunity to point out that field equipment is not safe and therefore systems can’t be secure. For them, the security of the field device is a high priority. Others, myself included, believe that we have far more critical security vulnerabilities related to Level 1 and Level 2 functions of the process control network, and that fixing these issues reduces the overall OT security risk more than addressing a much more difficult to remedy issue. This is due to the number of field devices and the technical complexity of such an improvement, topics I will discuss in more detail in the blog.


What’s the problem? First of all, we have to distinguish between two types of field devices: the “older” generation field devices that only have an analog interface, usually a 4 – 20 mA wired connection to a controller/PLC I/O board; and the intelligent devices that use digital communications, which provide the ability to remotely configure the field devices without having to be physically near the device. This offers an important safety advantage for plant personnel, of course this advantage also presents an opportunity for the threat actors to abuse this feature.

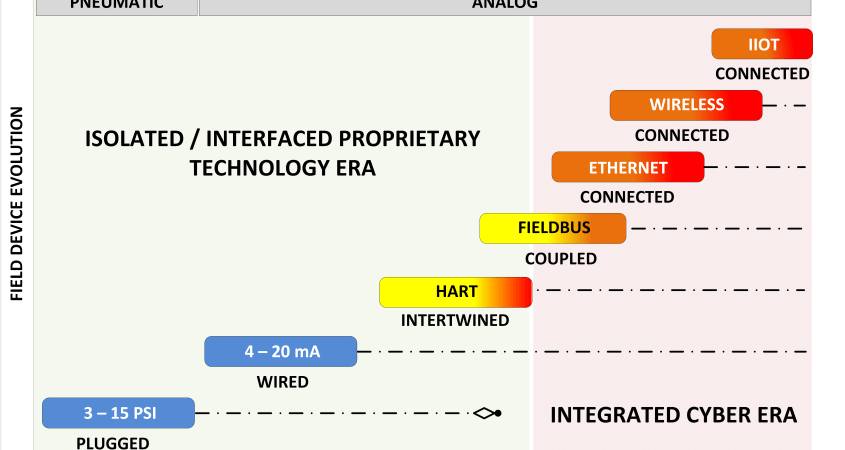
Because of the importance of field devices they can be an interesting target. In this blog I only consider the intelligent and connected devices because I consider the older generation to be secure as long as there is physical security protecting any changes using portable configurators in the field. In below diagram (FIGURE 1) I attempt to sketch the field device landscape. On the right side of FIGURE 1, which I called the cyber era, shows today’s situation. The left side of the diagram shows the isolated / interfaced proprietary technology era, not hindered by cyber attacks.

In the proprietary technology era, vendors positioned their technologies in a competitive manner from each other, while in the cyber era there is a more “collaborative environment” where different technologies are mixed and supported by multiple OT vendors through integration of different solutions. Today’s market demands that a vendor supports multiple technologies, where some of the technologies have a bigger presence in the market than others. Some technologies come close to celebrating their 40th birth day, I believe HART was introduced at the same time as the Rosemount 3051 transmitter. At that time Rosemount proprietary technology (Rosemount being an Emerson company today).


FIGURE 1 – Field device technology evolution

The yellow (medium) to orange to red (high) color shift indicates the growing risk due to the increasing number of attack scenarios we need to consider. The first digital protocols were introduced in the secure proprietary technology era, where systems that needed to interface with the corporate systems used serial protocols such as BSC, HDLC, and early network interfaces like DECNET. Networks were far more isolated as they are today. With the introduction of the open technology in the nineties interfacing changed to integrating, and vendors started to support a mix of technologies. This in a time were the security threat wasn’t considered in spite of the growing interconnectedness and interdependencies.

Networks were no longer isolated local networks, they became side wide networks, and today global networks connecting to the Internet and cloud services. Some technologies evolved from isolated intertwined architectures superposing a digital signal on top of an analog signal, to being used in network connected architectures where the traffic flow is less constrained than in the early days.

We see a stacking of different technologies with a different levels of attention for security. Because control systems have a long lifecycle based on a continuous evolution strategy of sometimes more than 40 years, many of these technologies are still in use. The value of the industrial property hidden in the development of decades of control applications and the high cost of replacement drives plants into this environment of a mixture of legacy and modern technologies.

Field device technologies developed 40 years ago are still in use today, while the system architectures in which these technologies are embedded, became more and more open and interconnected causing an increasing security gap that also impacts the field device security.

Can we easily secure field equipment? I often read demands for authentication, encryption, and signed software. Though some of these requirements could be met with today’s technology, many require more processing power than available today. An often used argument is to use more powerful processors, our smart watch is more powerful than any transmitter. But more powerful processors translate into requiring more electric power for the field device. But more electric power is an issue when we use these devices in industrial environments with explosive vapors. Much is done to reduce power allowing us to use these field devices safely in those environments. Environments that are quite common in the chemical and oil and gas industry, the need for intrinsic safe field devices is big, this limits the power level and so the processing power of the instrument.

There are many sides to the field device security problem, for me security doesn’t just depend exclusively on the resilience of the target. A security resilient target is nice to have, but if not available it is not the end of the story. We can and do much more to protect the field devices by for example managing the exposure of these devices to threat actors. In my opinion the security of the field devices is directly connected to the security of the level 2 and level 1 segments of the PRM. We discuss this in detail for the different field devices.


What can a threat actor do? The answer to this question depends very much on the field device technology that we discuss and how this device is used in the control and / or safety process of the plant. In this blog I limit my self to discussing three types of intelligent field devices: Transmitters / sensors; Valve positioners; and Process analyzers. If we apply these devices in a chemical or oil and gas process, a cyber failure of these devices can have serious consequences including consequences in the highest consequence rating category such as loss scenarios resulting in fatalities or physical damage to the process equipment.

To cause such a loss, requires that the threat actor creates the conditions where the production process moves into a critical state that is no longer under control by either the process operator or the safety systems. For example, a threat actor can do this by:

  • Manipulating the range of a field device so that it no longer corresponds to the actual process condition;
  • By turning off (setting them out of service) the field devices;
  • By adjusting the control action: for a positioner (e.g. travel rate); but also for a sensor if we reverse the range;
  • Or more simply by misrepresenting the actual physical state of the process (showing a low level, or a low oxygen ratio while actual values are higher) so that neither the operator nor a control program or a safety function would act in accordance with the design and/or operating intent required to prevent an unsafe state.

How can the threat actor do this? This is the actual topic of the blog, evaluating the various viable threats and what we can do and what is often already done to protect the system against these threats. For this discussion, I assume that the threat actor attacks the field equipment from an external network, and that the threat actor must therefore make extra efforts to reach the field equipment. This is not always the case when looking at the Industrial Internet Of Things (IIOT) solutions, but their application is still not as common in the refining and petrochemical industry and often used for less critical functions. IIOT and cloud security would be a different security topic, so not included in this discussion. Also when we consider malware, then we must conclude that some malware developments have shown the capability of conducting this type of attacks using scripts from inside the perimeter.


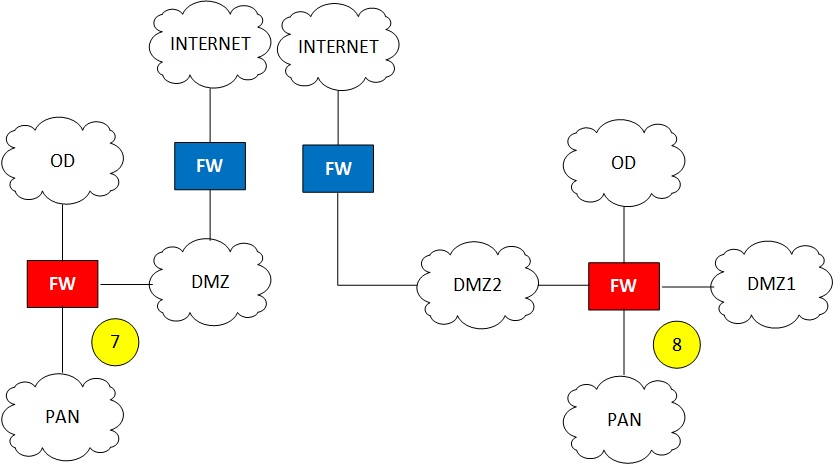
So I assume that the attacker is at an external location and attempts to attack the field devices, what are the options and which tactics, technologies, and procedures (TTP) has he/she available to succeed? In order to succeed the threat actor needs access to either level 3 (sometimes the management systems are located there) or level 2.

The diagram below shows a typical model of the network for a control system in the petrochemical / refining industry based on the use of a DCS (distributed control systems) and not a SCADA (as for example is the case for a pipeline). As the name already suggests, a DCS decentralizes the control functions, it is a cooperation of functions spread through the level 2 and level 1 network layers providing the overall control function. A SCADA on the other hand centralizes control functions by collecting data and taking central decisions, typically process operator controlled decisions. In a pipeline we would open and close the blocking valves and maintain a central overview with the SCADA, but the compression function in the substations is controlled using a DCS function.

FIGURE 2 – Typical zone and conduit architecture for a chemical plant or refinery

The diagram is not a 1 to 1 copy of IEC 62443. With some experience in professional life you will learn that standards are a good starting point, but rarely the answer to your specific problem. Having worked in the process industry for over 40 years, including more than 20 years in networking and security, I take the liberty of deviating from time to time where I think it offers benefits or improvements.

The diagram is based on the belief that the interconnectedness, which is the basis of an IEC 62443 zone and conduit diagram, does not accurately reflect how risk spreads through a system. The factor we’re missing is interdependence, as OT security risks propagate along the lines of dependencies. In addition to mapping conduits that represent interconnectedness, I therefore also consider interdependencies. Conduits show the traffic connections between security zones, but not the dependency between functions that are several “zone hops” away. Criticality and dependency analysis is therefore an important task in risk analysis.

As an example for the relationship between dependency and security, it is not uncommon that alarm levels are determined by engineers using alarm management applications whose user interface resides in the corporate network or the demilitarized zone. These alarm levels can be enforced and overwrite the actual alarm limits at controller level. This can be critical because often safety engineers take credit for these process alarms in their LOPA safety analysis. Based on a zone and conduit diagram this dependency and neither the threats misusing the dependency would be identified. An exclusive zone and conduit focus is too limited to address the many interdependencies that exist in an automation system, it creates too much focus on the technical infrastructure connecting the components while ignoring the more important function that is distributed over many components. It is in the end the automation function that is misused by the threat actor, the technical components are primarily an instrument to do this. This function has often multiple components, making a change in a process controller can therefore happen from several components playing different roles.

This is why I added the trust levels, when there are dependencies we need to consider trust. How much can I trust being dependent on this component, what kind of dependency is it? Trust must be earned, when we interact between functions or their components at the same trust level we can accept an intrinsic form of trust. However when the gap in trust grows an enforced level of trust is needed to offer more security. Working with trust levels allows us to formulate policies for trust related to dependencies, while encapsulating the interconnectedness model provided by the zone and conduit diagram.

Zones and conduits still need to be protected, but there are two higher levels above the technical component level (functional dependencies and process dependencies) that also need to be addressed for the hazard identification step in risk analysis, the dependency and trust analysis fills this IEC 62443 gap.

Automation systems have many examples of intrinsic trust, meaning that authentication and authorization is enforced at the point where the user (process operator / engineer) enters the data and not checked anymore along the path between the source and its final destination. However there can be several components (residing in different network segments) on this path between the source and destination. This is often the cause of vulnerabilities in control systems because if the attacker finds a way to “tap” into this path (man-in-the middle attacks to manipulate the data, or either inject new messages or replay old messages) there are no more checks and the data can be manipulated resulting into an action that does neither meet design or operation intent.

Protection against these attacks is at conduit level, however to identify the hazard and specifying the security requirements requires to include the identification of these dependencies. We will see later that this is also an issue when discussing field device security.


FIGURE 2 shows several network segmentation levels, the focus of our discussion will be on the levels 2, 1, and 0. This is where the attack on the field devices takes place in a properly protected system. However there are vendors that promote that the management systems reside at the level 3 of the model. This is because ISA 95 seemed to suggest this. However, ISA 95 never went into technical details for the levels 2, 1, and 0.

Managing the field devices (positioners, transmitters) and the process analyzers from level 3 is not advised because the step in trust level is more than 1. These technical management functions are better secured at level 2 of the architecture because they either need connectivity with the controllers (e.g. if HART pull through is supported) or the field equipment (e.g. if HART multiplexers are used).

Still it happens that these systems reside in the level 3 network segment because of cost savings (a single management system at level 3 can support multiple process units each with its own DCS) or DCS vendors prefer to keep 3rd party management systems outside the level 2 network segment dedicated to “their” DCS equipment. Never the less, field device and process analyzer management functions should preferably reside at level 2 and the perimeter between level 3 and level 2 should restrict access to this trusted level 2 area as much as possible. Accessing the restricted area from the level 3 network segment (jumping 2 trust levels) should never be done without additional risk controls increasing the protection of level 3 to “earn” the extra trust.

The red arrows in the conduit section of the diagram show some of the critical connections. The inbound connections from the corporate network (level 4) into the DMZ should be avoided, it is better to initiate the connection from the DMZ side so the inbound ports on the firewall can be closed by facilitating any return traffic using the stateful “awareness” functionality of the firewall. If we still need to use them because of a specific function, we should make certain that connections from the DMZ into the control network levels 3 and 2 should not use the same protocol as the inbound connection. If we have a path between the corporate network and the DMZ, toward the control network using the same protocol, a network worm compromising this protocol service can slip through the firewall and enter the control network. Connections from the DMZ toward level 2 should be prevented, never the less also here vendors have created solutions requiring them. But at minimum these cases should support an authenticated connection and enforce the same disjoint protocol rule as discussed for the connection toward the level 3 segment. The last red arrow is the connection between the level 2 segment and the level 0 segment. If it is a serial connection between a management server (for example an instrument asset management server (IAMS) connecting with a HART multiplexer) then the risk is limited, if the traffic would pass over the Ethernet to the HART multiplexer it should be protected by encryption so it becomes impossible to inject, replay, modify messages that can compromise the field devices.

It is necessary to protect the field equipment by implementing strict network access filters that block all traffic except those connections that need access. This should always be enforced for the traffic between the Level 3 and Level 2 segments, once at Level 2 there can be issues to maintain this policy because Level 2 and Level 1 segments are often a single Ethernet broadcast domain. So as such, all connected devices would be subject to a potential man-in-the-middle attack TTP, such as using ARP poisoning, or a message injection TTP. Access into level 2 can be accomplished in several ways, I will discuss this later.

The diagram also shows that I split the levels 1 and 0 into a control section and a safety section. I could have done this also for the level 2, however fully isolating the safety systems from the control systems is no longer possible. If we go back 30 years in time control systems (It is better to say the Basic Process Control System – BPCS) and safety systems (Safety Instrumented Systems – SIS) were fully isolated, even to a degree that some asset owners used different equipment rooms to isolate them as much as possible. Today this level of isolation no longer exists in the petrochemical and refining industry. Cost savings, process engineering bottlenecks (e.g. pipe length) and operation requirements have driven the solutions toward an integrated environment where process operators have a central view on the state of the control and safety functions, and where it is sometimes possible to reuse field devices for both control and safety. This all is no problem if we evaluate the process safety function along the traditional lines of availability based upon random product device failures. But we will see in the discussion that if we evaluate the process safety function including the cyber threats that the required independence of protection layers is at stake. This because the process control layer and the process safety layer have potential common points of failure due to a cyber attack, in some architectures even the independence of the preventative (ESD) and mitigation layers (F&G) of the process safety function can be impacted. We will discuss this later in the blog. The area that overlap the two level 1 and level 0 segments are drawn to express that there can be dependencies (both at functional level as well as at process level) that play a role. For example when we operate the overrides from the process operator console, or when we have 1 control transmitter combined with 2 safety transmitters in a 2oo3 architecture reducing the unavailability in order to meet a specific security integrity level (SIL), or even at the higher process level the safety valve might depend for its movement on the instrument air controlled by a compressor controlled in the control segment. Interconnectedness and dependencies are important and cause overlap that can result in common failures.


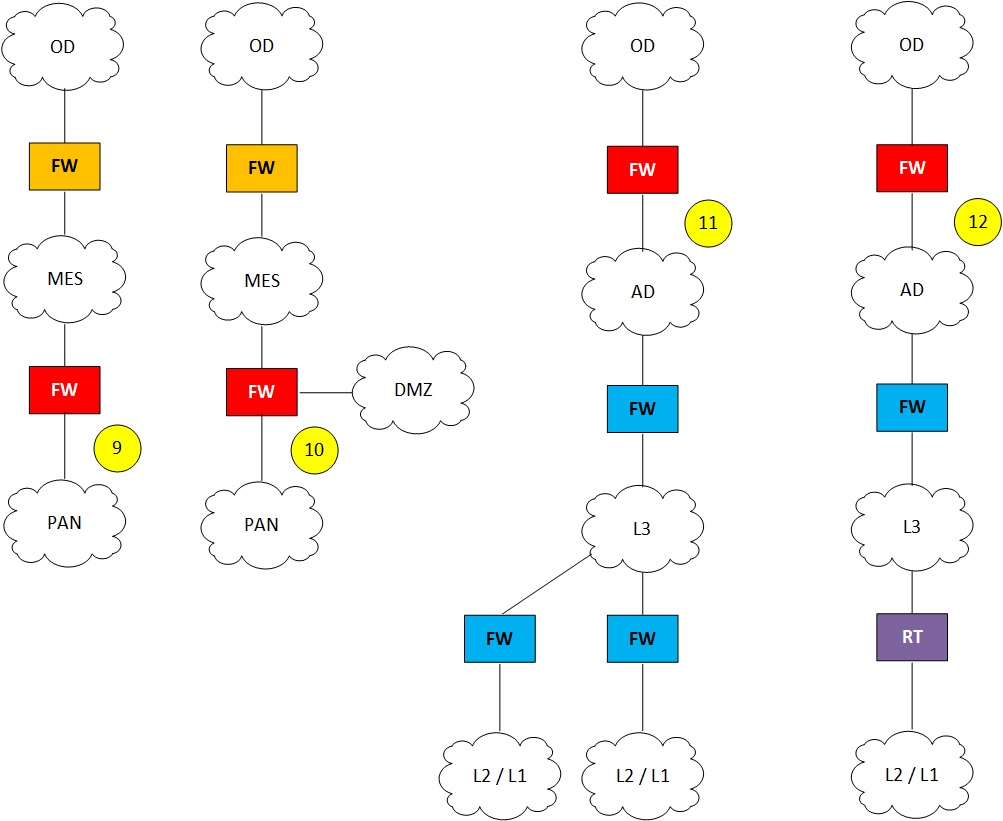
Let’s zoom in using the following more detailed diagram to explain the various threats that we have to counter in order to protect the field devices.

FIGURE 3 – Attack surface field devices

Perhaps a bit complex diagram because of its detail, but I created it to be able to discuss the various threats that the field devices face. The diagram shows the typical design of three field devices: a transmitter (marked A); a process analyzer (marked B); and a positioner (marked C). The diagram shows field devices with multiple interfaces, this is just for the explanation in reality a field device would typically support only one communication interface.

The other functions shown are: a process controller or alternatively a safety controller (marked H and F); a process controller (marked E); an analyzer management system (marked G); an instrument asset management system (IAMS – marked D); and a protocol converter / HART multiplexer (marked (I). The red arrows with the yellow numbers are the attack surfaces we will discuss.

From a network security perspective I discuss the HART protocol and the foundation fieldbus / Profibus protocols. These technologies are most often used, however all intelligent field devices have potential attack scenarios (see for the difference between potential and viable scenarios my earlier blog) even for those devices using the most recent technologies such as for example APL field devices. Proof of concepts have been developed for all of these during threat modelling sessions building large repositories of attack scenarios facilitating risk analysis.

Foundation Fieldbus and Profibus are in principle two different protocols but from a cyber attack perspective I can group them because they have similar characteristics from a threat actor perspective. HART transmitters can be directly connected to the control network using the HART multiplexers. The fieldbus devices always have either a controller or a gateway between the control network and the field devices. There are more differences between the two groups, and there are also differences between Foundation Fieldbus (FF) devices and Profibus devices. I will discuss those differences where applicable for a selected attack strategy / scenario.


I start with HART (the acronym for Highway Addressable Remote Transducer) a Rosemount communication protocol (presently Emerson) developed in the eighties of the previous century, so in a time cyber security for OT systems wasn’t a topic on the agenda. In the early nineties the HART Users group was formed to make the protocol an open standard for the industry. Today it is the most applied protocol in the petrochemical / refining industry for field devices. The protocol uses the traditional 4-20 mA current loop standard (introduced by Honeywell in the seventies) and superposes a Bell 202 frequency shift keying signal on top of it for the digital communication protocol. The digital communications part is a bidirectional half-duplex master-slave protocol, supporting two masters. The protocol has a relatively slow transmission rate of 1200 bits per second. The field devices can be implemented as one device per twisted pair connection, or up to 15 devices for a multidrop connection (typically RS 485 is used). When using “long form” addresses this can be extended to supporting 256 devices. The process value (PV) is communicated over the 4-20 mA current loop to the I/O card of the controller, but the HART protocol supports 3 more variables.

The digital communication also supports the exchange of the PV value, but adds three other values: Secondary Value (SV); Tertiary Value (TV); and quaternary value (QV). These values ​​(either measured or calculated) are used to provide additional information for the device, depending on the type and function of the device.

For example, a pressure transmitter could also measure temperature, a wide range of options are available depending on the device. Normally, the communication is initiated by the master, but devices can also support burst mode, in this case the field device initiates the communication by sending messages cyclically with short pauses in between. The primary master is normally the controller, but a secondary master can be a handheld terminal or an instrument asset management system (IAMS). The master(s) exchange a series of commands with the slaves. We have three groups of commands: the universal commands (supported by all devices); common practice commands (support differs for different functions); and device specific commands (differs per device and per vendor). In total there is a maximum of 255 commands for the protocol. Though the protocol supports broadcast demands, changes to the configuration can only de done device by device.

From a protocol perspective we have the:

  • Application layer (supporting the HART commands);
  • Transport layer (used when we use HART over a network, this layer takes care of error handling and recovery. And the transport layer breaks up large messages in smaller size messages – TCP);
  • Network layer (primarily switching and routing) using the IP protocol;
  • Data link layer providing an asynchronous half duplex serial connection;
  • Physical layer implemented using the Bell 202 FSK standard. HART transmitters don’t directly connect to the Ethernet, for this we need a protocol converter from Ethernet to RS 485 and a HART multiplexer to connect to multiple devices (See (I) in the diagram above).

So far the intro on the HART protocol. Let’s now discuss the attack surface for misusing this function.

HART devices are individually connected to a HART I/O card of a (either process or safety) controller or a PLC. If the device is a transmitter (A in the diagram) then the controller reads the PV directly from the 4 – 20 mA input signal, if we need access to the digital communication for reading or changing the configuration or for reading the SV/TV/QV values of the device this is possible in two ways:

  • HART pull through (the controller communicates with the device and offers the data as a service to the Ethernet side, either as HART TCP protocol or encapsulated in a vendor proprietary protocol.) If a vendor proprietary protocol is used to encapsulate the HART messages authentication / encryption might be available depending on the specific vendor. The HART TCP protocol doesn’t support either authentication or encryption;
  • or using a HART multiplexer that either connects serial to an instrument management device or over the Ethernet using a protocol converter.

The most secure access path is the HART pull through interface, because when this interface is used the controller generally offers various additional security settings that block write actions to the field device or require the field device to be in a maintenance mode prior to modifying configuration settings. However in some cases HART pull through is not supported, or the HART protocol is encapsulated within a vendor proprietary protocol. This results in that a management application supporting the field devices needs to make use of HART multiplexers, devices that create a multi drop bus (e.g. RS 485) connecting the devices. These multiplexers can be connected to the network using a protocol converter (See attack surfaces 1, 2, and 3). Such an architecture has a higher security risk. Let’s investigate:

  • Attack surface 1 is when the protocol flows over the Ethernet, the HART protocol doesn’t offer encryption or authentication so is vulnerable for message injection, message replay, message manipulation, and message sink hole techniques. The most critical attacks are the message injection attacks from any node on the network that can reach the protocol converter. HART is routable so depending on the network segmentation such a rogue node can be everywhere. Message injection and manipulation attacks can modify in the field devices, where replay attacks can “freeze” data read from the devices. However to do this in an “intelligent” way that threat actor needs to know the internal addresses / tags of these devices. So it is not an easy approach. Another attack strategy is creating a sink hole, sink hole attacks are generally a minor issue primarily blocking the exchange of SV, TV, and QV parameters which are normally not critical.
  • Attack surface 2 is the HART multiplexer, this would require physical access to connect a device to the serial bus in order to manipulate the serial data. So an insider attack, for which the likelihood is low.
  • Attack surface 3 is the protocol converter, normally also of little interest because the impact would be a denial of service. However in those cases where we combine the protocol converter with a secure encrypted tunnel between the HART master and the protocol converter it can become of interest. Normally we should create a secure tunnel between the master (e.g. IAMS) and the protocol converter / multiplexer, in that case the main threat would be a denial of service, either through attacking the protocol converter (configuration changes, firmware corruption) or creating a sink hole (attack surface 1). Unfortunately many installations have installed low cost protocol converters that do not create a secure encrypted tunnel but communicate the clear text HART messages over the network. These installations are vulnerable to all attacks identified for attack surface 1.

So summarized, there are multiple options to directly attack the field devices and manipulate their configuration if we install the HART function incorrectly. We can offset the measurements by changing the ranges, or by changing tuning values / biases. But we can also reverse ranges, and so indirectly reverse control action of the process loop. Another option is to disable the field device, or upload new firmware which would allow us to carry out much more intelligent attacks or just a very simple attack the installation by uploading corrupted firmware and disabling the field device.

Technically the last attack – firmware corruption – would have the biggest impact. Theoretically we can create an attack that would disable all connected field devices. The recovery time would be significant, independent from the potential equipment damage caused by solidifying materials in process equipment and pipelines and potential loss of containment. This type of attack is shown as attack surface 11 in the diagram.

The actual impact on the production process depends on the field device type. The following are critical consequences of such an attack:

  • Manipulation of the process value of a transmitter, this can result in process deviations or the possibility that a trip point of a safety controller is indirectly modified. This could initiate a wrong shutdown, or worse no shutdown if demanded. A more complex attack scenario would be to combine the attack on a safety transmitter with an attack on a process transmitter and create a process condition that could lead to critical process state. This is a difficult attack to conduct because it requires very detailed information of the process installation and its configuration, but theoretically possible and often facilitated by having both the process transmitter and the safety transmitter connected to the same HART multiplexer. Even if not used by the IAMS such a connection poses risk because of the message injection attacks. Best practices are: (1) always use tamper proof transmitters for safety transmitters that are connected to network connected HART multiplexers. This type of transmitters block write actions using a physical clip / switch; (2) don’t mix field devices of safety functions with field devices for control functions on the same HART multiplexer; (3) Consider splitting management of safety related field devices and control related field devices over multiple IAMS.
  • I already mentioned the possibility to corrupt the firmware of a field device. The loss of a single field device is not a problem, field device failure happens frequently in a plant the maintenance organization can cope with that. But a massive loss of field devices can lead to a major disaster. Including scenarios with potential fatalities would be a consequence if both safety and process control devices were impacted. If this loss would be caused by corrupted field devices recovery can become a time taking and difficult job.
  • Positioners is another category of field devices that can be impacted. Positioners are typically connected for monitoring valve performance (sticky valves) so generally these are positioners are part of control valves. But there are also possibilities to manage partial valve stroke tests through HART connections, this application would connect process safety valves and then the consequences can be much more severe. An attacker could modify the stroke length of the test (typically 10% but there is no limitation to set it to 100%), increasing the stroke length or initiating the test on a surprise moment, could cause a process shutdown or alternatively modify the settings of the positioner such that the valve wouldn’t move anymore or move with a too low or too high travel speed (potentially causing stress in the pipeline through water hammer). There are also valves that combine the control and safety function, though I am not aware of implementations using HART, these valves offer a series of alternative attack scenarios. But the field device market is huge, so maybe some vendors also support the HART protocol for this type of valve.
  • Positioners also have firmware that can be updated, and as such corrupted to either freeze the valve position or prevent it from closing / opening when demanded. Like transmitters, positioners are critical equipment. When we decide to manage them using network connectivity we need to be careful. In all cases where HART pull through can be applied the controllers will offer additional protection mechanisms, but the moment we use connectivity based on HART multiplexers we need to be aware of the different threats discussed for attack surface 1.

HART field equipment has by far the largest market segment, approximately 80% of the field devices used in the global petrochemical and refining market are HART devices. But there are other more powerful technologies in use, depending on where you live in the world sometimes even sometimes more popular than HART devices. The second biggest market segment after HART is the Profibus segment, if I combine the three technologies Profibus PA, Profibus DP, and Profinet. Profibus was introduced in 1989 and developed over time into Profinet, the ethernet connected version. Where Profibus didn’t consider cyber security, we will see that Profinet does. Profinet is a Siemens technology and very popular outside the US. Where Europe and large parts of Asia have chosen for Profinet, the US has chosen for Ethernet/IP a Rockwell automation technology. Let’s first look at the security issues of fieldbus technologies before we look at the industrial ethernet.


When we discuss the security of fieldbus technologies, we need to address exposure. The core of OT security is managing the exposure of the many technologies used. Where IT systems are very homogeneous, OT systems are not. Perhaps all computer systems have been migrated to a the latest Microsoft release, this is normally not through for the embedded technology such as process controllers, PLCs, RTUs, safety controllers, and field devices. Also the networks are a compilation of technologies using IT like TCP/IP based networks, but also ring networks, fiber optic networks, bus networks, wireless networks, satellite connections, etc. All of them being critical for the plant, because of the many dependencies a cyber failure in one of them can lead to a scenario impacting all. By managing exposure we can attempt to contain this impact. Managing exposure is managing opportunity, the lower the exposure the lesser the opportunity. Like I explained in a previous blog, there are basically three factors that determine if a threat actor will attack these are: intent, capability, and opportunity. If any of these three are missing we are secure. By managing the exposure the defense team reduces the threat actor’s attack surface and by doing this the team also reduces the opportunity for the threat actor.

FIGURE 4 – The threat ontology

We already concluded that field devices are vulnerable because they typically do not support authentication, authorization, signed data, or encryption techniques. All of these are important security controls that would protect the field device. However it is not uncommon to be vulnerable, this happens often and is no reason to panic. There are other means of defense than increasing the resilience of the target. We can add layers of protection, shielding the target from the threat actor. By this we reduce the exposure of the target for example by choosing a specific architecture, and we can build in security mechanisms within our protection layers that function as a proxy for the protection task of the field device.

FIGURE 5 – Protection layers shielding the vulnerability

In a properly secured system this is done at a level that the field devices are better protected than the layers surrounding them. A key characteristic of security and risk is that it breaks at the weakest point in the chain. So if this point is no longer the field device we have accomplished our security task. Let’s see how this works for the field bus devices and where we have to be careful.


There are two types of interfaces between controllers / PLCs where we process the field device input or output and the field devices. We can connect the field devices to an I/O module of the control device or we can use a gateway on the control network to interconnect the field device and the controller. From an architectural point of view there is a 3rd option related to yes / no using a firewall.

FIGURE 6 – Profibus architecture examples

An in depth Profibus (PROcess FIeld BUS) discussion is too much for the space of a blog, Profibus has many flavors with important application differences, and even my blogs shouldn’t become a book. So I focus on the three main versions, Profibus DP (Decentralized Periphery), Profibus PA (Process Automation), and an Ethernet version Profinet. I discuss the differences, starting with the two real fieldbus implementations Profibus DP and Profibus PA.

From a security perspective, these two protocols are similar, the main difference being the application of the two protocols, not so much their security resilience. Profibus DP supports faster data exchange (up to 12 Mbps) compared to Profibus PA (31.25 kbps). DP supports both mono master and multi master setup, both Profibus DP and PA are master slave protocols with different physical layers. DP communicates via a twisted pair connection (RS 485) or alternatively fiber optic link, while PA uses Manchester Bus Powered (MBP) technology. This is because PA technology is used in hazardous areas, which makes the higher power technology used by DP impossible. PA is normally used in combination with DP, as also described in Figure 6 above, the coupling device in the diagram connects the two. There is no direct communication between the master device on the DP side and the slave device on the PA side. The coupler acts as a proxy in this communication. We can connect field devices to both the DP bus and the PA bus, with the PA bus specifically intended for use in intrinsically safe environments.

From a systems exposure perspective, we have three different architectures (A, B, C). In case A, communication must be via the controller / PLC. The controller / PLC is connected to the Profibus DP bus with an I/O module. So to attack the field device, the threat actor must first attack the controller/PLC. A successful attack means a successful attack on a device that controls tens to hundreds of field devices. Once the controller/PLC is under the attacker’s control, it is no longer an advantage to take control of the field device.

In case B, a controller uses a Profibus gateway to connect to the Profibus DP network. In this case, the security of the field device depends on both the security of the message transfer between the controller and the gateway and the security of the gateway. This is often a problem because many of the protocols used at the control network level do not support encryption or authentication. This makes the architecture vulnerable to message injection, message replay, message modification, and message sink attacks. This indirectly exposes the field devices and should be considered a high-risk architecture that requires compensatory controls to protect the network segment.

In case C, the connection between the Profibus gateway and the controller is protected by a special micro firewall. This prevents the interception of the message exchange between controller and gateway on the control network. From an exposure perspective, this protects both the controller and messaging and can be considered a low-risk architecture. Of course everything depends on the firewall, if the communication through the control network with the controller uses the same protocol as the controller uses for communication with the Profibus gateway then we have scenarios that can target the controller and the risk is significantly higher . (More viable attack scenarios) Unfortunately, this is the case for several solutions on the market.

In sequence of risk (low to high) the architecture C is the most secure, and architecture B should be considered as the highest risk. But we also have to consider the maintenance and engineering functions. Profibus supports three types of masters: a DP class 1 master (MS0 (cyclic data) or MS1 (acyclic data)), a DP class 2 master (MS2), and a DP class 3 master. The class 3 master is a clock master for distributing the time. A controller or PLC is a DP class 1 master. The class 2 master is the function that is used for engineering, commissioning, and maintenance. A class 2 master is typically a PC with a dedicated engineering program capable of modifying configuration parameters in the DP slaves. In a Profibus network there is always at least one class 1 master present. The class 2 master function (D in the diagram) does not have to be online and can be connected if maintenance is required. When multiple masters are present a token is passed between the masters to control the traffic. All connected functions (masters and slaves (so also the field device)) use the Fieldbus Data Link (FDL) protocol for the exchange of process data, and there is a special Fieldbus Management (FMA) protocol for the management of the devices.

FIGURE 7 – Profibus protocol stack

FMA 1/2 (Fieldbus management of layers 1 and 2) provides the functions necessary for configuring the field devices. We have functions such as a reset, set value (set device parameters) , read value (read device parameters), event (signals errors), Service Access Point (SAP) activate and SAP deactivate (Used for differentiation between different services in a field device, you might consider it similar to a TCP address – e.g. a get configuration service or a diagnostic service), Ident (provides hardware / software versions), LSAP status (provides configuration information on a SAP), Live-List (Kind of broadcast providing a list of all active connected bus users). Each bus user has an address on the bus, these addresses are used to communicate between the class 2 master and the slaves (field devices). Message integrity is protected by a checksum. Where in a HART environment we could inject messages toward a HART mux at control network level, in Profibus DP / PA this is more difficult because either the controller or the gateway is in between. Even in those cases where we integrate HART transmitters in a Profibus solution, we would have the Remote IO function between the field device and the controller or gateway if targeted from the control network. So we can say that no direct communication from the control network with the transmitters is possible. Attacks must be carried out through message manipulation. Only if we would manage from the Ethernet level the Profibus DP nodes using an IAMS, passing through the gateway, we also have to consider message injection attack scenarios. However many gateways have build-in protection settings to prevent this type of modification without first enabling it. Therefore the Profibus environment is less exposed as the HART environment, and if there is exposure it is more an issue of the security of the controller, gateway or remote I/O boxes than the field device.

Lets switch to discussing Profinet, Profinet is the Ethernet based standard of Profibus. Both the field devices (slaves) and class 1 and class 2 masters are Ethernet connected. So from an exposure point of view, Profinet is far more exposed than Profibus DP / PA. Profinet uses a 100 Mbps Ethernet TCP/IP backbone for its communication. Profinet supports three levels of performance:

  • Engineering and other not time critical messages are transferred via TCP/IP and UDP/IP (100 ms response time – class A).
  • For time-critical process data a real-time channel is created implemented through special software drivers (10 ms response time – class B);
  • While for special applications such as motion control there is isochronous real-time communication with a less than 1 ms response time available- class C.

These requirements make Profinet segments very critical and therefor requires a very strict access control to prevent issues with the performance.

The network management covers all the functions for the administration of Profinet devices in Ethernet networks. These include the device and network configuration, for example, issue of IP addresses using standards like DHCP (dynamic host configuration protocol) as well as using network diagnostic messages based on standards like SNMP v2 (simple network management protocol); Integration of web functions, for example, access to components by means of standard technologies also used in the Internet field such as HTTP (hypertext transfer protocol), XML (extended mark-up language), HTML (hypertext mark-up language), and addressing with scripting; and field device integration. So all stuff that make a security guy very nervous. Profinet communicates with Profibus DP / PA devices using a proxy function (a gateway), but in this case it is direct interfacing with the field devices. The configuration is downloaded to the devices using GSD (General Station Description) files, written in xml using a special language called general station data mark-up language (GSDML).

Profinet is very susceptible to man in the middle attacks and requires a very strong access control and small segments. At this point in time Profinet offers least security of all field device protocols and for risk estimation purposes I identified more than 20 viable attack scenarios if not properly protected. More than any of the other field device protocols discussed so far.

How about Foundation Fieldbus? We have two main types of Foundation Fieldbus architectures. HSE which is based on the Ethernet technology, and the more commonly used H1 which is in many ways similar to Profibus PA.

FIGURE 8 – Foundation Fieldbus Protocol Stack

The H1 physical layer is a 31.25 kbps version of the IEC ISA Fieldbus using a synchronous Manchester technique to allow for its use in intrinsic safe environments. Fieldbus uses a token mechanism where a token circulates between the connected devices and scheduled access based on time windows. So mixture of scheduled real-time performance and a token bus for less critical communication. The scheduling is managed by a link active scheduler node, the LAS.

From a security point of view, the data on the H1 bus is serial and unprotected. But an attacker would have to have physical access to manipulate the data. There are basically three architectures available, controllers with an FF I/O module and two architectures that use a gateway. In that regard, the three architectures discussed for FIGURE 6 (A, B, C) are also in use for FF. With exactly the same security issues, with architecture C being preferred, then architecture A, and architecture B the least secure solution.

An additional feature of FF is that it can combine the field device and control action all at H1 level. This further reduces the exposure of the solution. From a configuration point of view it has the same issues as Profibus DP.

The HSE version is Ethernet based and therefore provides a better communication performance using a 100 Mbps Ethernet cable. The benefit of HSE is that it can connect multiple H1 segments over a longer distance because the maximum length of the H1 bus is set to 120 m depending on the number of connected devices. But architectures that use Foundation Fieldbus gateways to connect a H1 segment do basically the same. If we look at the protocol stack we see many similarities with Profinet, such as the use of DHCP and SNMP (Again typically version 2 is supported). Protocols that add attack scenarios to take into account for our protection.

FIGURE 9 – Foundation Fieldbus HSE architecture

Like mentioned HSE is typically used to connect H1 bus segments, because Foundation Fieldbus devices can also have a control function this connection can also be used for setting up primary / secondary control structures creating peer to peer traffic between maybe a transmitter field device on one H1 segment and a control / transmitter / positioner combination on a second H1 segment. Though this is an exception, it is technically supported by the FF standard and therefor used by control engineers. The H1 Interfaces in the drawing represent the bridge configuration where the connections between the two segments are defined as a bridge making them behave as a single segment. The Virtual Field Devices (VFD) represent the field devices to be managed. The HSE LRE function (LAN Redundancy Entity) keeps track of the status of the network and its devices. It is an application layer function exchanging diagnostic messages with the various connected devices. So an interesting target to disrupt traffic. Foundation Fieldbus describes the application in terms of blocks, we have different types of blocks:

  • Resource blocks – These define the fieldbus device from a hardware perspective such as specifying the manufacturer, and serial number number. But there is an additional parameter that allows us to set the device out of service, basically stopping all other functions of the device;
  • Transducer blocks – This is used to configure the I/O of the devices, define such things as the sensor / actuator type, and calibration.
  • Function blocks – These perform the process control functions, this can be simple analog in or analog out functions but also control algorithms such as a PID function, algorithmic functions for flow compensation, etc. All of this is defined using a Device Description Language (DDL). These device descriptors can be stored in an IAMS (Instrument Asset Management System) and uploaded / downloaded and as such manipulated by a threat actor. FF does not protect the integrity of the device descriptor other than the integrity during the data transfer against bit failures. However a device must be out of service (Resource block parameter) to change its configuration. But once done everything can be done, it is more or less equivalent to having full access to a process controller. However now in the form of a fully standardized function, no vendor specific implementation. DDL defines everything nicely independent of the vendor making the device.

Process alarms are in a foundation fieldbus environment originating in the field device, not the controller. Therefore these messages are also of interest for an attacker, creating a sink hole for this type of message can be part of an advanced attack scenario.

So HSE foundation fieldbus offers the threat actor interesting opportunities, this because we now combine control and field devices at the same level with little protection against a series of traffic manipulation attacks at Ethernet level. Before I move to the management system issues lets summarize the my conclusions with regard to sensor security. (I am aware I ignored Industrial Ethernet, too big for this already too long blog).

CONCLUSIONS ON FIELD DEVICE ARCHITECTURES

  • From a field device security perspective based on exposure I consider the most secure architecture for field devices Profibus DP / PA and the Foundation Fieldbus H1 architecture. But only for the architectures A and C from FIGURE 6.
  • HART is a close second as long as we have no HART multiplexers in the architecture. The main reason for me putting HART on the second place is that it is more easy to attack the field device firmware. Never the less HART without HART mux and Profibus DP/PA, Foundation Fieldbus H1 have a low probability of success for the attacker if attacked.
  • PROFINET and HSE Foundation Fieldbus are considerably more exposed than above technologies (so more viable attack scenarios). Their security depends for a large part on the security of the control network segment they are connected to.
  • So overall, if we consider the market size of the technologies discussed, I think the field device security is not the biggest issue. The bigger issue is in my opinion the access security to the critical control segments and the management systems discussed in the next block.

So far I looked at the field devices from an architectural perspective, how is their system exposure, how easy is it for the attacker to get access to these devices. My conclusion, see above, is that the field device exposure isn’t the biggest issue and as such the resilience of these devices against a cyber attack is not my biggest worry. But there are other paths to consider, for example the instrument asset management system (IAMS). The function we use to maintain the field devices, tune them, configure them.

In FIGURE 2, I have shown the Purdue reference model, depending on the vendor, these systems are installed at Level 2 or Level 3. First, because some IAMS functions have a much wider scope than field equipment management, they can provide a range of asset management tasks including functions for managing the process equipment such as pumps. In my opinion functions that have direct interfaces with the field devices at level 0 should be installed at level 2 to reduce their exposure. This is specifically of importance if over the network access is created with HART multiplexers.

IAMS supports Electronic Data Description (EDD) files that describe the data in the field device. Field device manufacturers create these files for managing their field devices. The IAMS reads these files in order to learn how to read and write to the device. This is a text file written in device description language (DDL). An attacker might target these files and manipulate the data in a way that these write / read activities lead to wrong results. The only security controls available to protect these files are the file system access controls. With the development of new extensions such as EDDL visualization and Persistent Data Storage threat actors have increased possibilities to mislead maintenance engineers.

A Electronic Device Description (EDD) file is used, an EDD file, written in the DDL, provides an extended description of each object in the VFD (See figure 9); it provides information needed for a control system or host to understand the meaning of the data in the VFD including the human interface for functions such as calibration and diagnostics. Thus, the EDD can be thought of as a “driver” for the device; any control system or host can operate with the device if it has the device’s EDD. EDD file is used together with a Capability File (CF) to fully describe a device.

The CF describes for a Foundation Fieldbus device the functions and the capabilities of the device; it tells the IAMS or sometimes controller or gateway what resources the device has in terms of function blocks and VCRs (Virtual Communication Relationship) etc. This allows the IAMS to configure the device even if it is not connected to it, basically you can make these files offline and store them later on the IAMS as part of the attack strategy. The idea is that the IAMS can ensure that only functions supported by the device are allocated to it, and that other resources are not exceeded. However when we manipulate these files, like mentioned only protected by their filename and directory in which they reside, this is no longer guaranteed.

Another technology used is the Field Device Manager (FDT), a function that is a container for something we call the Device Type Manager (DTM). The FDT is the common part and a software function that is part of the IAMS. The DTM is software the field device manufacturer provides. The FDT standard supports all the main field device technologies, so HART, Profibus, Foundation Fieldbus, etc. We have two types of DTMs, a device DTM supporting the communication at application level with the device and a communication DTM supporting the communication with the device (e.g. the HART protocol). Many of the DTM software is published by the manufacturer of the field device and offered as downloadable components. So in theory a supply chain attack can manipulate this software and be used to attack the field devices, but in case of the COM DTM also all other components connected to the network. An additional issue is that because a DTM runs within the FDT container not all security controls catch a non-authorized DTM.

A third technology, an integration of the EDD and FDT technologies, is the FDI (Field Device Integration) initiative. The FDI architecture is a client/server architecture based on OPC UA. OPC UA is a standard that does consider security using both authentication and encryption technology. However its day to day support is not yet big. The EDD / FDT technology is still the dominant technology in the industry.

Controllers often have read / write enable parameters for protecting the field devices against being modified. However some DTMs do not support a situation where write is disabled, this prevents frequently that we can use this control to protect the field device. This happens even in cases where from a functionality view there doesn’t seem to be a reason for writing toward the field device. So plenty of opportunity for an attacker to attack the field devices using the IAMS. This can even be more critical when we mix control and safety field device management in the same IAMS host.


I also consider process analyzer (B in FIGURE 3) as field equipment. However their exposure differs very much from the field devices such as sensors and positioners. Their interface with the process and safety controllers is typically hardwired, 4-20mA signals. The problem for process analyzers is the management interface. Traditionally analyzers had only this hard wired output, however today this is no longer true. Analyzers have become self-calibrating, self diagnosing, and add many “intelligent” functions. Though an excellent development it made them also more vulnerable to cyber attacks. To pass their information to central management systems and sometimes to the control system either serial or network network connections are used toward a management system. This management system is often placed at level 3 of the PRM (See FIGURE 2) and can be used to offset the measurements of the process analyzer. Additionally analyzer management systems might connect to the corporate network to interface with the laboratory instrument management system (LIMS). So technically we have an access path from LIMS at level 4 of the PRM to the analyzer management system at level 3, to the process analyzer at level 0. The protocol used toward the analyzers is OPC, typically classic OPC. The protocol used toward the LIMS and other users would be either HTML 5 or ODBC.

Even if analyzer networks are often separate from the control network and “dual-homed” connected through the analyzer management system this remains a risk. A dual homed connected network can easily be connected / bridged when the analyzer management system is compromised. Enabling an IP forwarding setting would connect the analyzer network to the control network if necessary for the attack, but for most attack scenarios access to the analyzer management system itself is sufficient for success.

This is critical because many analyzers have a safety function triggering a safety instrumented function if a specific concentration or ratio is too high. An additional attack surface is offered by using mobile devices that have a wireless connection with the corporate network and get their information from the analyzer management system. This makes process analyzers an interesting target often overseen.


I realize there is still a lot of unexplored territory (IIOT, Industrial Ethernet) but still I think for the chemistry/refining/oil and gas world most of the topics have been touched on. My general conclusion is that there is plenty to worry about in regards to field equipment, but most problems can be covered by having a good level of protection for the level 2 network segment. I think if we miss such good protection, we’ll be in big trouble anyway, the vulnerable field equipment doesn’t make it much worse.


There is no relationship between my opinions and references to publications in this blog and the views of my employer in whatever capacity. This blog is written based on my personal opinion and knowledge build up over 45 years of work in this industry. Approximately half of the time working in engineering these automation systems, and half of the time implementing their networks and securing them, and conducting cyber security risk assessments for process installations since 2012.


Author: Sinclair Koelemij

OTcybersecurity web site

Bolster your defenses.

The Ukraine crisis will almost certainly raise the cyber security risk for the of rest Europe. The sanctions imposed on Russia demand an increased awareness and defense effort for securing the OT systems. These sanctions will hurt and shall undoubtedly become an incentive for an organized revenge from very capable threat actors. What could be more effective for them than cyberattacks at a safe distance.

I think all energy-related installations such as for example port terminals, pipelines, gas distribution, and possibly power will have to raise their level of alertness. Until now, most attacks have focused on the IT systems, but that does not mean that IT systems are the only targets and the OT systems are safe. Attacking the OT systems can cause a much longer downtime than a ransomware attack or wiping disk drives would, so such an attack might be seen as a strong warning signal.

Therefor it is important to bolster our defenses. Obviously we don’t have much time, so our response should be short term, structural improvements just take too much time. So what can be done?


Let’s create a list of possible actions that we could take today if we want to brace ourselves against potential cyber attacks:

  • Review all OT servers / desktops that have a connection with an external network. External including the corporate network and partner networks. We should make sure that these servers have the latest security patches installed. Let’s at minimum remove the well known vulnerabilities.
  • Review the firewall and make certain they run the latest software version.
  • Be careful which side you manage the firewall from, managing from the outside is like putting your front door key under the mat.
  • Review all remote connections to service providers. Such connections should be free from:
    • Open inbound connections. An inbound channel can often be exploited, more secure remote access solutions poll the outside world for remote access requests preventing any open inbound connections.
    • Automatic approvals on access requests, make sure that every request is validated prior to approval for example using a voice line.
  • Modify your access credentials for the remote access systems, they might have been compromised in the past. Use strong passwords of sufficient length (10+) and character variation. Better is of course to combine this with two-factor authentication, but if you don’t have this today it would take too much time to add it. Would be a mid-term improvement, this list is about easy steps to do now.
  • Review the accounts that have access, remove stale accounts not in use.
  • Apply the least privilege principle. Wars make the insider threat more likely to happen, enforcing the least privilege principle will raise the hurdle.
  • Ensure you have session time outs implemented, to prevent that sessions remain open when they are not actively used.
  • Review the remote server connections. If there are inbound open ports required make sure the firewall restricts access as much as possible using at minimum IP address filters and TCP port filters. But better would be (if you have a next generation firewall in place) to add further restrictions such as restricting the access to a specific account.
  • Review your antivirus to have the latest signature files, the same for your IPS vaccine files.
  • Make certain you have adequate and up-to-date back-ups available. Did you ever test to restore a back-up?
    • You should have multiple back-ups, at minimum 3. It is advised to store the back-ups on at least 2 different media, don’t have both back-ups online accessible.
    • Make sure they can be restored on new hardware if you are running legacy systems.
    • Make sure you have a back-up or configuration sheet for every asset.
  • Hardening your servers and desk tops is also important, but if you never did this it might take some time to find out which services can be disabled and which services are essential for the server / desk top applications. So probably a mid-term activity, but reducing the attack surface is always a good idea.
  • Have your incident response plan ready at hand, and communicated throughout the organization. Ready at hand, meaning not on the organizational network. Have hardcopies available. Be sure to have updated contact lists and plan to have communications using non-organizational networks and resources. (Added by Xander van der Voort)

I don’t know if I missed some low hanging fruit, if so please respond to the blog so I can make the list more complete. This list should mention the easy things to do, just configuration changes or some basic maintenance. Something that can be done today if we would find the time.


Of course, our cyber worries are of a totally different order than the people in Ukraine are now experiencing for their personal survival and their survival as an independent nation. However the OT cyber community in Europe must also take responsibility and map out where our OT installations can be improved / repaired in a short time, to reduce risk.

Cyber wars have no borders, so we should be prepared.

And of course I shouldn’t forget my focus on OT risk. A proper risk assessment would bring you an insight in what threat actions (at TTP level) you can expect, and for which of these you already have controls in place. In situations like we are in now, this would be a great help to quickly review the security posture and perhaps adjust our risk appetite a bit to further tighten our controls.

However if you haven’t done a risk assessment at this level of detail today, it isn’t feasible to do this short term therefore it is not in the list. All I could do is going over the hundreds of bow-ties describing the attack scenarios and try to identify some quick wins that raise the hurdle a bit. I might have missed some, but I hope that the community corrects me so I can add them to the list. A good list of actions to bolster our defenses is of practical use for everyone.

I am not the guy that is easily scared by just another log4j story, but now I think we have to raise our awareness and be ready to face some serious challenges on our path. So carefully review where the threat actor might find weaknesses in your defense and start fixing them.


There is no relationship between my opinions and references to publications in this blog and the views of my employer in whatever capacity. This blog is written based on my personal opinion and knowledge build up over 43 years of work in this industry. Approximately half of the time working in engineering these automation systems, and half of the time implementing their networks and securing them, and conducting cyber security risk assessments for process installations since 2012.


Author: Sinclair Koelemij

OTcybersecurity web site

Inherent more secure design

The question I raise in this blog is: “Can we reduce risk by reducing consequence severity?” Dale Peterson touched upon this topic in his recent blog.

It has been a topic I struggled with for several years, initially thinking “Yes, this is the most effective way to reduce risk”, but now many risk assessments (processing thousands of loss scenarios) later I come to the conclusion it is rarely possible.

If we visualize a risk matrix with horizontally the likelihood and vertically the consequence severity, we can theoretically reduce risk by either reducing the likelihood or the consequence severity. But is this really possible in today’s petro-chemical, refining, or oil and gas industry? Let’s investigate.


If we want to reduce security risk by reducing consequence severity, we need to reduce the loss that can occur when the production facility fails due to a cyber attack. I translate this in we need to create an inherently safer design.

This topic is already a very old topic addressed by Trevor Kletz and Paul Amyotte in their book “A handbook for inherently Safer Design, 2nd edition 2010”. This book is based on an even earlier work (Cheaper, safer plants, or wealth and safety at work: notes on inherently safer and simpler plants – Trevor Kletz 1984) from the mid-eighties which shows that the drive to make plants inherently safer is a very old objective and a very mature discipline. Are there any specific improvements to the installation that we did not consider necessary from a process safety point of view, but should be done from an OT security point of view?

Let’s look at the options we have. If we want to reduce the risk induced by the cyber threat we can approach this in several ways:

  • Improve the technical security of the automation systems, all the usual stuff we’ve written a lot of books and blogs about – Likelihood reduction;
  • Improve automation design, use less vulnerable communication protocols, use more cyber-resilient automation equipment – Likelihood reduction;
  • Improve process design in a way that the threat actor has less options to cause damage. For example do we need to connect all functions to a common network so we can operate them centrally, or is it possible to isolate some critical functions making an orchestrated attack more difficult – Likelihood / consequence reduction;
  • Reduce the plant’s inventory of hazardous materials, so if something would go wrong the damage would be limited. This is what is called intensification/minimization – Consequence reduction;
  • An alternative for intensification is attenuation, here we use a hazardous material under the least hazardous conditions. For example storing liquefied ammonia as a refrigerated liquid at atmospheric pressure instead of storage under pressure at ambient temperature – Consequence reduction;
  • The final option we have is what is called substitution, in this case we select safer materials. For example replacing a flammable refrigerant by a non-flammable one – Consequence reduction.

So theoretically there are four options that reduce consequence severity. In the past 30 years the industry has invested very much in making plants more safe. There are certainly still unsafe plants in the world, partially a regional issue / partially lack off regulations, but in the technologically advanced countries these inherent unsafe plants have almost fully disappeared.

This is also an area where I as OT security risk analyst have no influence, if I would suggest in a cyber risk report that it would be better for security risk reduction to store the ammonia as a refrigerated liquid they would smile and ask me to mind my own business. And rightfully so, these are business considerations and the cyber threat is most likely a far less dangerous threat than the daily safety threat.

Therefor the remaining option to reduce consequence severity seems to be to improve process design. But can we really find improvements here? To determine this we have to look at where do we find the biggest risk and what causes this risk?

Process safety scenarios where we see the potential for severe damage are for example: pumps (loss of cooling, loss of flow), compressors, turbines, industrial furnaces / boilers (typically ignition scenarios), reactors (run-away reactions), tanks (overfilling), and the flare system. How does this damage occur? Well typically by stopping equipment, opening or closing valves / bypasses, manipulating alarms / measurements/positioners, overfilling, loss of cooling, manipulating manifolds, etc.

A long list of possibilities, but primarily secured by protecting the automation functions. So a likelihood control. The process equipment impacted by a potential cyber attack are there for a reason. I never encountered a situation where we identified a dangerous security hazard and came to the conclusion that the process design should be modified to fix it. There are cases where a decision is taken not to connect specific process equipment to the common network, but this is also basically a likelihood control.

Another option is to implement what we call Overrule Safety Control (OSC) this is a layer of safety instrumentation, which cannot be turned off or overruled by anything or anybody. When the process conditions enter a highly accident-prone, life-safety critical state such as for example the presence of hydrogen in a sub-merged nuclear reactor containment (mechanically open the enclosure to flood the containment with water) or the presence of methane on an oil drilling rig, an uninterruptible emergency shutdown is automatically triggered. However this is typically a mechanical or fully isolated mechanism because as soon as it has an electronic / programmable component it can be hacked if it would be network connected. So I consider this solution also as a yes/no connection decision.

I don’t exclude the possibility that situations exist where we can manage consequence severity, but I haven’t encountered them in the past 10 years analyzing OT cyber risk in the petro-chemical, refining, oil & gas industry apart from these yes / no connect questions. The issues we identified and addressed were always automation system related issues, not process installation issues.

Therefor I think that consequence severity reduction, though the most effective option if it would be possible, is not going to bring us the solution. So we end up focusing on improving automation design and technical security managing the exposure of the cyber vulnerabilities in these systems, Dale’s suggested alternative strategy seems not feasible.

So to summarize, in my opinion there is not really an effective new strategy available by focusing on reducing cyber risk by managing consequence severity.


There is no relationship between my opinions and references to publications in this blog and the views of my employer in whatever capacity. This blog is written based on my personal opinion and knowledge build up over 43 years of work in this industry. Approximately half of the time working in engineering these automation systems, and half of the time implementing their networks and securing them, and conducting cyber security risk assessments for process installations since 2012.


Author: Sinclair Koelemij

OTcybersecurity web site

OT security engineering principles

Are there rules an engineer must follow when executing a new project? This week Yacov Haimes passed away at the age of 86 years. Haimes was an American of Iraqi decent and a monument when it comes to risk modeling of what he called systems of systems. His many publications among which his books “Modeling and Managing Interdependent Complex Systems of Systems” (2019) and “Risk Modeling, Assessment, And Management” (2016) provided me with a lot of valuable insights that assisted me to execute and improve quantitative risk assessments in the process industry. He was a man who tried to analyze and formalize the subjects he taught and as such created some “models” that helped me to better understand what I was doing and guide me along the way.

Readers that followed my prior blogs know that I consider automation systems as Systems of Systems (SoS) and have discussed these systems and their interdependencies and interconnectedness (I-I) often in the context of OT security risk. In this blog I like to discuss some of these principles and point to some of the gaps I noticed in methods and standards used for risk assessments conflicting with these principles. To start the topic I introduce a model that is a merger between two methods, on one side the famous 7 habits of Covey and on the other side a system’s development process, and use this model as a reference for the gaps I see. Haimes and Schneiter published this model in a 1996 IEEE publication, I kind of recreated the model in Visio so we can use it as a reference.

A holistic view on system’s engineering Haimes and Schneiter (C) 1996 IEEE

I just pick a few points per habit where I see gaps between the present practice advised by standards of risk engineering / assessment and some practical hurdles. But I like to encourage the reader to study the model in far more detail than I cover in this short blog.

The first Stephen Covey habit is, habit number 1 “Be proactive” and points to the engineering steps that assist us in defining the risk domain boundaries and help us to understand the risk domain itself. When we start a risk analysis we need to understand what we call the “System under Consideration”, the steps linked to habit 1 describe this process. Let’s compare this for four different methods and discuss how these methods implement these steps, I show them above each other in the diagram so the results remain readable.

Four risk methods

The ISO 31000 is a very generic model, that can be used both for quantitative risk assessment as well as qualitative risk assessment. (See for the definitions of risk assessments my previous blog) The NORSOK model is a quantitative risk model used for showing compliance with quantitative risk criteria for human safety and the environment. The IEC/ISA 62443.3.2 model is a generic or potentially a qualitative risk model specifically constructed for cyber security risk as used by the IEC/ISA 62443 standard in general. The CCPS model is a quantitative model for quantitative process safety analysis. It is the 3rd step in a refinement process starting with HAZOP, then LOPA, and if more detail is required than CPQRA.

Where do these four differ if we look at the first two habits of Covey? The proactive part is covered by all methods, though CCPS indicates a focus on scenarios, this is primarily so because the HAZOP covers the identification part in great detail. Never the less for assessing risk we need scenarios.

An important difference between the models rises from habit 2 “Begin with the end”. When we engineer something we need clear criteria, what is the overall objective and when is the result of our efforts (in the case of a risk assessment and risk reduction, the risk) acceptable?

This is the first complexity and strangely enough are these criteria a hot topic between continents, my little question “when is risk acceptable?” is for many Americans an unacceptable question, the issue is their legal system which mixes “acceptability” and “accountability” so they translate this into “when is risk tolerable”. However the problem here is that there are multiple levels for tolerable. European law is as usual diverse, we have countries that follow the ALARP principle (As Low As Reasonably Practical) and we have countries that follow the ALARA principle (As Low As Reasonably Achievable). ALARP has a defined “DE MINIMIS” level, kind of a minimum level where we can say risk is reduced to a level that is considered an acceptable risk reduction by a court of law. Contrary to ALARA where we need to reduce the risk to the level it is no longer practicable, so there is no cost criterium but only a pure technical criterium.

ALARP, ALARA comparison

For example the IEC/ISA 62443-3-2 standard compares risk with the tolerable level without defining what that level is. For an ALARA country (e.g. Germany, Netherlands) that level is clearly defined by the law and the IEC / ISA interpretation (stopping further risk reduction at this level) would not be acceptable, for an ALARP country (e.g. UK) the limits and conditions are also well defined but cost related. The risk reduction must go all the way to the DE MINIMUS level if cost would allow it. Which is in cyber security for a chemical plant often the case, this because the cost of a cyber incident – that can cause one or multiple fatalities – in the UK this cost is generally higher than the cost of the cyber security measures that could have prevented it. The cost of a UK fatality is set to approx. 1.5 million pound, actually an American is triple that cost 😊according to the US legal system, the Dutch and Germans (being ALARA) are of course priceless.

So it is important to have clear risk acceptance criteria established and objectives when we start a risk assessment. If we don’t – such as is the case for IEC/ISA 62443.3.2 comparing initial and residual risk with some vaguely defined tolerable risk level – the risk reduction most likely fails a legal test in a court room. ALARP / ALARA are also legal definitions, and cyber security also needs to meet these. Therefore the step risk planning is an essential element of the first NORSOK step and in my opinion should always be the first step, engineering requires a plan towards a goal.

Another very important element according Haines is the I-I (interdependencies, interconnectedness) element. Interconnectedness is covered by IEC/ISA 624433.2 by the zone and conduit diagram, conduits connect zones, though these conduits are not necessarily documented at the level allowing us to identify connections within the zone that can be of relevance for cyber risk (consider e.g. ease of malware propagation within a zone).

Interdependencies are ignored by IEC/ISA 62443. The way to identify these interdependencies is typically conducting a criticality analysis or a Failure Mode and Effect Analysis (FMEA). Interdependencies propagate risk because the consequence of function B might depend on the contribution of function A. A very common interdependency in OT is when we take credit in a safety risk analysis for both a safeguard provided by the SIS (e.g. a SIF) and a safeguard provided by the BPCS (e.g. an alarm), if we need to reduce risk with a factor 10.000, there might be a SIL 3 SIF defined (factor 1000) and the BPCS alarm (factor 10). If a cyber attack can disable one of the two the overall risk reduction fails. Disabling process alarms is relatively easy to do with a bit of ARP poisoning, so from a cyber security point of view we have an important interdependency to consider.

Habit 1 and 2 are very important engineering habits, if we follow the prescriptions taught by Haines we certainly shouldn’t ignore the dependencies when we analyze risk as some methods do today. How about habit 3? This habit is designed to help concentrate efforts toward more important activities, how can I link this to risk assessment?

Especially when we do a quantitative risk assessment vulnerabilities aren’t that important, threats have an event frequency and vulnerabilities are merely the enablers. If we consider risk as a method that wants to look into the future, it is not so important what vulnerability we have today. Vulnerabilities come and go, but the threat is the constant factor. The TTP is as such more important than the vulnerability exploited.

Of course we want to know something about the type of vulnerability, because we need to understand how the vulnerability is exposed in order to model it, but if we yes/no have a log4j vulnerability is not so relevant for the risk. Today’s log4j is tomorrow’s log10k. But it is essential to have an extensive inventory of all the potential threats (TTPs) and how often these TTPs have been used. This information is far more accessible than how often a specific exposed (so exploitable) vulnerability exists. We need to build scenarios and analyze the risk per scenario.

Habit 4 is also of key importance, win-win makes people work together to achieve a common goal. The security consultant’s task might be to find the residual risk for a specific system, but the asset owner typically wants more than a result because risk requires monitoring, risk requires periodic reassessment. The engineering method should support these objectives in order to facilitate the risk management process. Engineering should always consider the various trade-offs there are for the asset owner, budgets are limited.

Habit 5 “Seek first to understand, then to be understood” can be directly linked to the risk communication method and linked to the perspective of the asset owner on risk. So reports shouldn’t be thrown over the wall but discussed and explained, results should be linked to the business. Though this might take considerably more time it is never the less very important.

But not an easy habit to acquire as engineer since we often are kind of nerds with an exclusive focus on “our thing” expecting the world to understand what is clear for us. One of the elements that is very important to share with the asset owner are the various scenarios analyzed. The scenario overview provides a good insight in what threats have been evaluated (typically close to 1000 today, so a sizeable document of bow-ties describing the attack scenarios and their consequences) and the overview allows us to identify gaps between the scenarios assessed and the changing threat landscape.

Habit 6 “Synergize”, is to consider all elements of the risk domain but also their interactions and dependencies. There might be influences from outside the risk domain not considered, never the less these need to be identified another reason why dependencies are very important. Risk propagates in many ways, not necessarily exclusively over a network cable.

Habit 7 “Sharpen the saw”, if there is one discipline where this is important than it is cyber risk. The threat landscape is in continuous movement. New attacks occur, new TTP is developed, and proof of concepts published. Also whenever we model a system, we need to maintain that model, improve it, continuously test it and adjust where needed. Threat analysis / modelling is a continuous process, results need to be challenged, new functions added.

Business managers typically like to develop something and than repeat it as often as possible, however an engineering process is a route where we need to keep an open eye for improvements. Habit 7 warns us against the auto-pilot. Risk analysis without following habit 7 results in a routine that doesn’t deliver appropriate results, one reason why risk analysis is a separate discipline not just following a procedure as it still is for some companies.


There is no relationship between my opinions and references to publications in this blog and the views of my employer in whatever capacity. This blog is written based on my personal opinion and knowledge build up over 43 years of work in this industry. Approximately half of the time working in engineering these automation systems, and half of the time implementing their networks and securing them, and conducting cyber security risk assessments for process installations since 2012.


Author: Sinclair Koelemij

OTcybersecurity web site

OT security risk and loss prevention in industrial installations

Approximately 30 years ago J. Bond (Not James but John – “The Hazards of Life and All That”) introduced the three laws of loss prevention:

  • He who ignores the past is condemned to repeat it.
  • Success in preventing a loss is in anticipating the future.
  • You are not in control if a loss has to occur before you measure it.

The message for cyber security seems to be that when we measure and quantify the degree of resilience that OT security provides or an installation requires, we learn something from that. When we measure, we can compare / benchmark, predict and encapsulate the lessons learned in the past in a model looking into the future. One way of doing this is by applying quantitative risk methods.

Assessing risk is done using various methods:

  • We can use a qualitative method which will produce either a risk priority number or a value on an ordinal scale (high, low, ..) for the scenario (if scenarios are used, we discuss this later) for which the risk is estimated. The qualitative method is very common because it is easy to do, but often also results in a very subjective risk level. Never the less I know some large asset owners used such a method to assess cyber security risk for their refinery or chemical plant. Care must be taken that qualitative risk assessments don’t result in a form generic risk assessment, becoming more a risk awareness exercise than providing risk in terms of likelihood and consequence as a base for decision making.
  • Another approach is to use a quantitative method, which will produce a quantitative threat event frequency, or probability value for an attack scenario analyzed and considers how risk reduction controls reduce the risk. Quantitative methods require more effort and are traditionally only used in critical situations, for example in cases where an incident can result in fatalities. This because regulatory authorities specify quantitative limits for both worker risk and societal risk for production processes. Today we have also computational methods developed that reduce the effort of risk estimation significantly. An advantage of a quantitative method is that a quantitative result expresses risk in terms of likelihood (event frequency or probability) and consequence and links these to the risk reduction the security measures offer. Providing a method of justification.
  • A Generic risk assessment is an informal risk assessment, e.g. an asset owner and my employer wants me to consider the risk whenever I apply changes to an OT function. Generic risk is a high level process, considering what are the potential impacts of the modification, where can things go wrong, how do I recover if it goes wrong, who needs to be aware of the change and the potential impact? Most of us are very familiar with this way of accessing risk, for example when we cross a busy street we do this immediately. Also generic risk assessments are used by the industry, but they are informal and depend very much on the skills and experience of the assessor.
  • Dynamic risk assessment is typically used in situations where risk continuously develops such as is the case for firemen during a rescue operation, or a security operations center might apply this method while handling a cyber attack trying to contain the attack.

If we need to estimate risk for loss events during the conceptual or design phase of an industrial facility, we estimate risk for potential consequences for human health, environment, and finance. In those cases a quantitative method is important because it justifies the selected (or ignored) security measures. A quantitative risk assessment for loss events is an extension of the plant’s process safety risk analysis, typically a process safety HAZOP normally followed by a LOPA.

In oil and gas, refining and the chemical industry it is quite normal that the HAZOP identifies hazards that can result in fatalities or significant financial loss. Just like there are loss scenarios identified that result in serious environmental impact. For hazards concerning human safety and environmental loss the governments have set limits, limits that set a limit on how often such an event may occur per annum.

These limits are used by process safety engineers for setting their design targets for each consequence rating (Target Mitigated Event Likelihood – TMEL) on which they base the selection of the safeguards that reduce the risk in order to meet the required TMEL. Such a risk estimation process is typically carried out in the Layers Of Protection Analysis (LOPA). LOPA is a high level risk estimation process that typically follows a HAZOP. The HAZOP follows a systematical method to identify all potential safety hazards with their causes and consequences. The LOPA is the step following a HAZOP analysis performing a high level risk analysis for estimating a mitigated event likelihood frequency of the most critical hazards, for example the hazards with a high consequence rating.

LOPA is a semi-quantitative method using a set of predefined event frequencies for specific accidents (e.g. pump failure, leaking seal, ..) and predefined values for the risk reduction that safeguards offer when mitigating such an event. For example a safety instrumented function with SIL 2 safety integrity level offers a risk reduction of factor 100, a SIL 3 safeguard would offer a factor 1000, and a process operator intervention a factor 10. The SIL values are a function of the reliability and test frequency of the safeguard. Based upon these factors a mitigated event likelihood is estimated, and this likelihood must meet the TMEL value. If this is not the case additional or alternative safeguards (controls) are added to meet the TMEL value. Loss events for industrial installations are assigned a consequence rating level, and for each rating level a TMEL has been defined. For example the highest consequence rating might have a TMEL of 1E-05 assigned, the one but highest 1E-04, etc.

For the law the cause of a consequence like a fatality or environmental spill is irrelevant, the production process must offer a likelihood level that meets the legal criteria whatever the cause. For example we might need to meet a TMEL of 1E-06 for a consequence involving multiple fatalities for a greenfield installation in Europe, or a maximum TMEL of 1E-05 for existing brown field installations. This means that if a cyber attack can cause a fatality / irreversible injury, or major environmental damage, the likelihood of such an event (so its event frequency) must meet the same TMEL as is valid for the safety accident. The law doesn’t give bonus points for the one (safety) being accidental, and the other (cyber security) being intentional. Risk must be reduced to the level specified. To estimate such an event likelihood frequency as result of a cyber attack requires a quantitative process. So far the introduction.


Let’s first look at loss events and how they can arise in a production facility like a chemical plant. For this I created the following overview picture for showing the relevant automation function blocks in a production process. It is a high level overview ignoring some shared critical support components such as a HVAC that can also cause loss events if it would fail, or various management systems (network, security, documentation, ..) that can be misused to get access to the OT functions. I also ignore the network segmentations for now, network segmentation is managing the exposure of the functions so important for estimating the likelihood but not for this loss event discussion.

Overview of the automation functions

I start my explanation with discussing the blocks in the diagram.

  • Process Control Functions – These are the collection of functions that control the production process, such as the basic process control system function (BPCS), the compressor control function (CCS), power management function (PMS), Advanced Process Control functions (APC), Motor Control Center function (MCC), Alarm Management function (ALMS), Instrument Asset Management function (IAMS), and several other functions depending on the type of plant. All specialized systems that execute a specific task in the control of a production process.
  • Process Safety Functions – Examples of process safety functions are the Emergency Shutdown function (ESD), burner management function (BMS), fire and gas detection function (F&G), fire alarm panel function (FAP), and others. Where the control functions execute the production process, the safety function guards that the production process stays within safe process limits and intervenes with a partial or full shutdown if this is not the case.
  • Process diagnostic functions – Examples of process diagnostic functions are machine monitoring systems (MMS) (e.g. vibration monitoring), and process analyzers (PA) (e.g. oxygen level monitoring). These functions can feed the process safety function with information that initiates a shutdown. For example the oxygen concentration in a liquid is measured by a process analyzer, if this concentration is too high an explosion might occur if not prevented by the safety function. Process analyzers are typically clustered in management systems that control their calibration and settings. These functions are network connected, similar as is the case for analyzers also HART, Profibus, or Foundation Fieldbus are network connected and can be attacked.
  • Quality control functions – For example a Laboratory Information Management System (LIMS) keeps track of the lab results, is responsible for the sample management, instrument status, and several other tasks. Traditionally LIMS was a function that was isolated from the process automation functions, but nowadays there are also solutions that feed their data directly into the advanced process control (APC) function.
  • Process metering functions – These are critical for custody transfer applications, monitoring of production rates, and in oil and gas installations monitor also well depletion. For liquids the function is a combination of a pump and precision metering equipment, however there are also power and gas metering systems.
  • Environmental monitoring systems – These systems monitor for example the emission at a stack or discharges to surface water and groundwater. Failure can result in regulatory violations.
  • Business functions – This is a large group of functions ranging from systems that estimate energy and material balances to enterprise resource planning (ERP) systems, tank management functions, and jetty operation and mooring load monitoring are considered in this category. This block contains a mixture of OT related functions and pure information technology systems (e.g. ERP), exchanging information with the automation functions. Business function is not the same as an IEC 62443 level 4 function, it is just a group of functions directly related with the production process and potentially causing a loss event when a cyber attack occurs. They have a more logistic and administrative function, but depending on the architecture can reside at level 3, level 4 or level 5.
  • Process installation / process function – Least but not last the installation that creates the product. The pumps, generators, compressors, pipes, vessels, reactors, etc. For this discussion I consider valves and transmitters for a risk perspective to be elements of the control and safety functions.

The diagram shows numbered lines representing data and command flows between the function blocks. That doesn’t mean that this is the only critical data exchange that takes place, also within the blocks there are critical interactions between functions and their components that a risk assessment must consider. Such as for example the interaction between BPCS and APC, BPCS and CCS, BPCS and PMS, ESD and F&G. But also data exchange between the components of the main function, for example the information flow between an operator station and a controller in a BPCS, or the data flow between two safety controllers of a SIS. However that is at detailed level and mainly of importance when we analyze the technical attack scenarios. For determining the loss scenarios these details are of less relevance.

The diagram attempts to identify where we have direct loss (safety, environmental, financial) as result of the block functions failing to perform their task or performing their task in a way that does not meet the design and operational intentions of the function. Let’s look at the numbers and identify these losses:

  1. This process control function information / command flow can cause losses in all three categories (Safety, environmental, finance). In principle a malfunction of the control system shouldn’t be able to cause a fatality, the safety function should intervene in time, never the less scenarios exist that are out of control of the process safety function where an attack on the BPCS can cause a loss with a high consequence rating. These cyber attack scenarios exist for all three categories, but of course this also depends on the type and criticality of the production process and the characteristics of the process installation.
  2. Process safety functions have the task to intervene when process conditions are no longer under control by the process operator, however they can also be used to cause a loss event independent of the control function. A simple example would be to close a blocking valve (installed as a safety mechanism to isolate parts of the process) on the feed side of a pump, this would overheat and damage the pump if the pump wouldn’t be stopped. Also when we consider burner management for industrial furnaces multiple scenarios exist that can lead to serious damage or explosions if purge procedures would be manipulated. Therefore also the process safety function information/command flow can cause losses in all three categories (Safety, environmental, and finance).
  3. Process diagnostic functions can cause loss events by not providing accurate values, for example incorrect analyzer readings or incorrect vibration information. In the case of rotating equipment a vibration monitoring function can also cause a false trip of for example a compressor or generator. Also this diagnostic function data and command flow can cause losses in all three categories (Safety, environmental, finance), specifically cyber attacks on the process analyzer through their management system can have serious consequences including explosions with potentially multiple fatalities. Analyzers are in my opinion very much under-estimated as potential target, but manipulated analyzer data can result in serious consequences.
  4. The flow between the process control and process safety functions considers the exchange of information and commands between the control function and the process safety function. This would typically be alarm and status information from the process safety function and override commands coming from the process control function. Unauthorized override actions, or false override status information can lead to serious safety incidents. Just as loss SIL alarms can result in issues with the safety function not being noticed. In principle this flow can cause losses in all three categories (Safety, environmental, finance) though serious environmental damage is not likely.
  5. The flow between the diagnostic and control functions might cause the control function to operate outside normal process conditions because of for example manipulating process analyzer data. In principle this can cause both environmental and financial damage, but most likely (Assuming the process safety function is fully operational) no safety issues. So far I have never came across a scenario for this flow that scores in the highest safety or environmental category, but multiple examples exist for the highest financial category.
  6. The flow between the diagnostic and process safety functions is more critical than flow 5. This because flow 6 typically triggers the process safety function to intervene. If this information flow is manipulated or blocked, the process safety function might fail to act when demanded resulting in serious damage or explosions with losses in all three categories (Safety, environmental, finance).
  7. This information flow between the quality control function, the process installation, and the process function is exclusively critical for financial loss events. The loss event can be caused by manipulated quality information leading to off spec product either being produced or sold to customers of the asset owner.
  8. Manipulation of the information flow between the business functions and the control functions has primarily a financial impact. Though there are exceptions, for example there exist permit to work solutions (business function) that integrate with process operator status information. Manipulation of this data might potentially lead to safety accidents due to decisions based on incorrect status data.
  9. Manipulation of the information flow between metering functions and the business functions results primarily in financial damage. It normally has neither a safety or environmental impact. However the financial damage can be significant.
  10. The environmental monitoring function is an independent stand-alone function which loss is typically a financial loss event as result of not meeting environmental regulations. But minor environmental damage can be a consequence too.

Now we have looked at the loss events I like to change to the topic on how these loss events occur as result of a cyber attack on the automation functions. The diagram I created for this shows on the right side loss event categories, categories for process loss events and categories for business loss events. I don’t further discuss these in this blog, but these categories are used in the risk assessment reporting to group the risk of loss events allowing various comparison metrics showing differences between process installations. Primarily used for benchmarking, however this data gives an interesting view on the criticality of cyber attacks for different industries and the community.

Loss and threat relationship

The above graphic introduces which cyber security threats we analyze in a risk assessment and why. Threats are basically modelled as threat actors executing threat actions exploiting exposed vulnerabilities resulting in some unwanted consequence. We bundle threats in hazards, for example the hazard unauthorized access into a BPCS engineering HMI would be the grouping of all threats (attack scenarios) that can accomplish such unauthorized access. If the threat would succeed to accomplish this unauthorized access, a hazard would also have a series of consequences. These consequences are different depending on if we discuss the risk for the production process / installation or the risk for the business functions. Typically loss events for a process installation can be a safety, environmental, or financial loss event. While the impact on the business functions is typically financial loss.

Important to realize is that risk propagates, something that starts in the process installation can have serious impact for the business processes, but reverse is also true something that starts by a compromise of the business functions can lead to serious failures in the production installation. There for a risk assessment doesn’t separate IT and OT technology, it about functions and their mutual dependencies. This is why a criticality assessment (business impact) is an important instrument for identifying the risk domain for a risk analysis.

In a risk analysis we map the technical hazard consequences on the process and business loss scenarios. On the process / installation side there are basically two potential deviations: either the targeted function doesn’t perform anymore meeting design or operation intent; or the targeted function stops doing its task all together. These can result in process loss events. On the business side we have the traditional availability, confidentiality, and integrity impact. Data transfers can be lost, or their confidential content can get exposed, or the data can be manipulated all resulting in business loss events.

So the overall risk estimation process is identifying the scenarios (process and business), identify if they can be initiated by a cyber attack, if so then identify the functions that are the potential target and determine for these functions the cyber attack scenarios that lead to the desired functional deviations.

These attack scenarios are coming from a repository of attack scenarios for all the automation functions and their components in scope of the risk analysis. Doing this for multiple threat actors, multiple automation functions, and different solutions (having different architectures, using different protocols, having different dependencies between functions) for different vendors leads to a sizeable repository of cyber attacks with the potential security measures / barriers to counter these attacks.

In an automated risk assessment the technical architecture of the automation system is modelled in order to take the static and dynamic exposure of the targets (assets and protocols) into account, consider the exploitability of the targets, consider the intent, capabilities, and opportunity of the threat actors, and consider the risk reduction offered by the security measures. The result is what we call the threat event frequency, which is the same as what is called the mitigated event likelihood in the process safety context.

So far the attack scenarios considered are all single step attack scenarios against a targeted function. If the resulting mitigated event likelihood (MEL) meets the target mitigated event likelihood (TMEL) of the risk assessment criteria we are ready, the risk would meet the criteria. If not, we can add security measures to further reduce the mitigated event likelihood. In many cases this will reduce the MEL to the required level, if all functions are sufficiently resilient against a single step cyber attack than we can conclude the overall system is sufficiently resilient. However there are still cases where the TMEL is not met, even with all possible technical security measures implemented. In that case we need to extend the risk estimate by considering multi-step attack scenarios in the hope that this would reduce the overall probability of the cyber attack.


A multi-step attack scenario introduces significant challenges for a quantitative risk assessment. First we need to construct these multiple step attack scenarios, these can be learned from historical cyber attacks and otherwise using threat modelling techniques. Another complication is that in analyzing single step attack scenarios we used event frequencies, in multi-step attack scenarios this is no longer possible because we need to consider the conditional probability for the steps. The possibility of step B typically depends on the success of step A. So we need to convert the mitigated event frequencies of a specific single step into probabilities. This requires us to use a specific period, so calculate the probability for something like: “what is the probability that a threat with a mitigated event frequency of once every 10.000 years will occur in the coming 10 years”. Having a probability value we can add or multiply the probabilities in the estimation process. The chosen period for the probability conversion is not of much importance in this case because in the end we need to convert probability back into event frequency for comparison with the TMEL. Of more importance is if the conditional events are dependent or independent, this tells us to either multiply (independent) or add (dependent) probabilities which either increases or decreases likelihood.

For example if we have a process scenario that requires both to attack the control engineering function and the safety engineering function simultaneously, the result differs significantly if these functions require two independent cyber attacks or if a single cyber attack can accomplish both attack objectives. As would be the case if both engineering functions would reside in the same engineering station. This is why proper separation of the control and safety functions is also from a risk perspective very important. Mathematics and technical solutions go hand in hand.

So in a multi-step scenario we consider all steps of our attack scenario toward the ultimate target that creates the desired functional deviation impacting the production process. If these were all independent steps the conditional probability would have decreased compared with the single step estimate and as such also the likelihood if we convert the resulting conditional probability back into an event frequency (using the same period – e.g. the 10 years in my example). So far I never met a case where this wasn’t sufficient to be able to meet the TMEL. However it is essential to construct a multi-step scenario with the least amount of steps, otherwise we get an incorrect result because of too many steps between the threat actor and the target.

Never the less there is the theoretical possibility that in despite of considering all security measures available, in despite of considering the extra hurdles a multi-step attack poses, we still don’t meet the TMEL. In that case we have a few options:

One possibility is considering another risk strategy, so far we chose a risk mitigation strategy (trying to reduce risk using security measures). An alternative strategy can be a risk avoidance strategy, choosing for abandoning the concept all together or as alternative redesign the concept using another technical solution which potentially offers more or different options to mitigate the risk.

Risk strategies such as sharing risk (insurance) or spreading risk typically don’t work when it concerns non financial risk such as safety risk and environmental risk.

But as I mentioned so far I never encountered a situation where the TMEL could not be met with security measures, in the majority of the cases the compliance can be reached by analyzing single step scenarios for the targets. In some critical cases multi-step scenarios are required to estimate if risk reduction meets the criteria.

We might ask ourselves the question are we not overprotecting the assets if we attempt to solve mitigation by first establishing resilience against single step cyber attacks. This is certainly a consideration in the case where the insider attack can be ignored, but be aware that the privileged malicious insider typically can execute a single step attack scenario because of his / her presence within the system and having authorizations in the system. Offering sufficient protection against an insider attack most often requires procedures, non-technical means to control the risk. However so far there is no method developed that estimates the risk reduction of procedural controls for cyber security.


So what does a quantitative risk assessment offer? Well first of all a structural insight in a huge amount of attack scenarios, a growing amount of attack scenarios. It offers a way to justify investment in cyber security. It offers a method to show compliance with regulatory requirements for worker, societal, and environmental risk. And overall it offers consistency of the results and therefore a method for comparison.

What are the challenges, we need data for event frequencies. We need a method to estimate the risk reduction for a security measure. And we need knowledge, detailed knowledge on the infrastructure, the attack scenarios, process automation, a rare combination that only large and specialized service providers can offer.

The method does not provide actuarial risk, but it proofed in many projects to provide reliable and consistent risk. The data challenge is typically handled by decomposing the problem in smaller problems for which we can find reliable data. Experience and correction over time makes it time after time better. Actually in the same way as the semi quantitative LOPA method gained acceptance in the process safety world, the future for cyber risk analysis is in my opinion quantitative.

Strangely enough there are also many that disagree my statement, they consider (semi-)quantitative risk for cyber security as impossible. They often select as an alternative a qualitative or even a generic method, but both qualitative and generic methods are based on even less objective data. More subjective and not capable of proofing compliance to risk regulations. So the data argument is not very strong and has been concurred in many other risk disciplines. The complexity argument is correct, but that is time and education. Also LOPA was not immediately accepted, and LOPA as it is today is very structured and relatively simple to execute by subject matter experts. However we can also discuss data reliability for the LOPA method, comparing LOPA tables used by different asset owners also leads to surprises. Never the less LOPA has offered a tremendous value for a consistent and adequate process safety protection.

Process safety and cyber security differ very much but are also very similar. I believe cyber security must follow the lessons learned by process safety and adapt these for their own unique environment. This doesn’t happen very much resulting in weak standards such as for example the IEC 62443-3-2 ignoring what happens in the field.


There is no relationship between my opinions and references to publications in this blog and the views of my employer in whatever capacity. This blog is written based on my personal opinion and knowledge build up over 43 years of work in this industry. Approximately half of the time working in engineering these automation systems, and half of the time implementing their networks and securing them, and conducting cyber security risk assessments for process installations since 2012.


Author: Sinclair Koelemij

OTcybersecurity web site

Process safety risk, cyber security risk and societal risk

Introduction

I wanted my next blog to be a blog on quantitative risk estimation using the TRITON attack scenario, published by MITRE Engenuity some months ago, as the example for an estimation. But as I started writing the blog I kind of got lost in side notes to explain the choices made.

Topics such as the difference between threat based risk and asset based risk, the regulations around societal risk, conditional likelihood, repeatable events, dependent and independent events, and threat analysis levels slipped in the text making it a blog even longer than usual for me. But it are all elements that play an important role in quantitative risk analysis and require some level of understanding to understand the estimation method.

So I decided to split the blog into multiple blogs and discuss some of these topics as separate blogs before publishing the blog on the TRITON / TRISIS risk. The first topic I like to discuss is societal risk and how this impacts process safety and most of all how it can impact cyber security risk criteria. But let’s start with process safety and its relationship with societal risk.

Process Safety risk and Societal risk

Societal risk is not an easy topic to discuss because it has a direct relationship to the law in a country. As such, there are differences between countries. Words can become very important, even ALARP can mean different things in different countries and some countries don’t even follow ALARP but work with ALARA only the difference of one word from Practical to Achievable, but a world of difference in the court room. In this blog I focus on Europe, although I encountered similar regulations in the countries of the Middle East and also saw examples in Asia and expect them to be in the US too.

Societal risk has a direct relationship with process safety and as such there is an indirect relationship with cybersecurity. Cybersecurity as one of the enablers of the functional safety task in a production installation such as a chemical factory or refinery.

The topic of quantitative risk analysis and its criteria is discussed in great detail in the CCPS (Center for Chemical Process Safety) publication “Guidelines for developing quantitative safety risk criteria”, actually a must read for OT cyber risk professionals. Though published in 2009, so before the StuxNet (2010) and TRITON/TRISIS (2017) cyber security incidents – therefore no reference to cyber security risk, the principles discussed are still relevant today.

The StuxNet attack showed us the vulnerability of production processes for cyber attacks and the TRITON/TRISIS attack showed us that the process safety function is not necessarily guaranteed during such a cyber attack. So societal risk caused by cyber attacks should be high on our agenda, however it is not.

Regulations of governments set risk criteria that apply to the impact a production process “may” have on individuals or a group of people. Regulations focus on the impact and how frequent it occurs, the cause of this impact is not relevant. This cause can be either a random failure in the production installation or an intentional failure caused by a cyber attack. The societal risk criteria of the law don’t differentiate between the two.

Since zero risk does not exist, we can only reduce the likelihood (the frequency of the occurrence) that a specific harmful event occurs. Preventing it to occur by elimination (risk avoidance) would mean abandoning the production process. We sometimes do this, for example Germany abandoned nuclear power generation, but most often we attempt to reduce the likelihood to lower the risk. The law has specified average event frequencies that set limits for the likelihood of these events, these limits are guiding the process safety design of a production facility but now also set requirements for the cyber security design if we consider loss based risk.

The relationship between societal risk and process safety risk.

Let’s first define risk, the CCPS definition of risk is:

“Risk is a measure of human injury, environmental damage, or economic loss in terms of both the incident likelihood and the magnitude of the loss”

The criteria for each are specified differently with so far a strong focus of the regulations on human injury and environmental damage. Though the recent wave of ransomware attacks has also shifted government attention toward economic loss, but there are no limits set. My focus in the blog is human injury, so process safety.

Let’s consider a simplified imaginary process safety scenario. We have a reactor that needs cooling to prevent a run-away reaction if the temperature is too high, a run-away reaction that would build-up pressure to a level that might cause an explosion or a loss of containment of a hazardous (perhaps flammable) vapor that can cause multiple fatalities. This cooling is provided by a jacket filled with water, water that is supplied and circulated by a pump.

This type of scenario is quite common. A potential cause for creating such a run-away reaction would be the failure of the pump, a pump failure would stop the circulation of the cooling water allowing the reactor to heat up with the potential run-away reaction. The plant’s process safety design has set a target that requires reducing the likelihood of such an event happening to 1 event per 10.000 year. If we know the average event frequency of the pump failure we can consider additional risk reduction controls that reduce the likelihood to the 1E-04 limit. The process for estimating such risk reduction is LOPA (Layer Of Protection Analysis), a quantitative method for process safety risk assessment. A process safety hazop is a qualitative method and is as such not capable of generating a likelihood frequency.

LOPA uses a table of event frequencies for various failures that can occur, for example the expectancy for a pump to fail is generally set to once every 10 years. We could attempt to improve the reliability of the pump by having a redundant pump, but we still might have a common factor that would impact both pumps. For example a cyber attack might be such a common factor, or maybe a power failure if both pumps would be electrical driven.

It would be difficult and costly to realize a reliability of the pump function that meets the 1E-04 criterium of our example. So instead we use a process safety function to reduce the risk by automatically bringing the reactor into a safe state after the pump failure preventing the explosion and / or loss of containment.

If we ignore any attempts to improve the pump’s reliability we need a safety instrumented function (SIF) that is able to bring the reactor into a safe state, this function needs a reliability that reduces the risk by a factor 1000 (1E-03).

A SIF is an application that is triggered by some event, perhaps the flow rate of the cooling water or the temperature in the reactor vessel, to start initiating actions (closing / opening valves) bringing the reactor in a safe state. Reducing the risk requires that all components used by the SIF have a reliability that meets the reliability criteria that result in the risk reduction with a factor 1000. This is where the safety integrity limit (SIL) comes in.

A SIF typically requires input from one or more sensors (e.g. a flow sensor), some safety instrumented system (SIS) executing the program logic, and one or more safety valves to create the safe state of the reactor. All components of the SIF together need to meet the reliability requirement to reduce the risk with the required factor. A SIL 3 SIF means we reduce risk with a factor 1000, a SIL 2 SIF would be a factor 100. The SIL is a function of the mean time between failure (MTBF) of the components and a test frequency.

Chemical plants typically require SIL 2 or SIL 3 safety systems to be able to meet the criteria. To reach the SIL level, the SIS must have a reliability level that meets SIL 3 criteria. But also the MTBF of the field equipment needs to meet the requirements. If the MTBF of a transmitter would be too low to meet the criteria we would use multiple transmitters and perhaps a 2oo3 voting mechanism to reach this reliability. Same is true for the safety valves, we may have multiple safety valves in series to increase the likelihood that at least one will act. The SIS is a very special type of controller with many diagnostic functions monitoring the various internal states of the controller and its I/O connections to make certain that it performs when demanded. For this, SIS undergoes a series of certification tests allowing it to claim a specific SIL level. So process safety is capable by using reliable functions to prevent an event from causing a high impact.

So in our example above, the process safety function reduced the risk with a factor 1000. As result we have now a likelihood of 1E-04 that a loss of containment or explosion occurs with a potential consequence of multiple fatalities due to the pump failure. This example has many simplifications, but it explains the principle of how we reduce risk in process safety.

The other question I need to answer is why did we choose the 1E-04 and not 1E-02 or 1E-06? This is where the regulations around societal risk come into the picture. Governments set these limits. So lets take a more detailed view on topics like individual risk, societal risk, and aggregate risk before linking all to cyber security risk.

Societal risk

Early examples of quantitative risk assessments (QRA) for the process industry go back to the early seventies with the Canvey island study in the UK, the Rijnmond study in the Netherlands and an LNG project study in California. Today QRA is the standard approach resulting in quantitative risk criteria for the industry and standardization of the risk estimation method. Regulation exist for both individual risk and societal risk.

Individual risk expresses the risk to a single person exposed to a hazard, where societal risk expresses the cumulative risk to groups of people affected by the incident. This makes societal risk more complex because it is a measure on a scale based on the number of people impacted. Sometimes the term aggregate risk is used, aggregate risk is the special case of societal risk for on-site personnel in buildings.

Criteria for societal risk are more strict than for individual risk, also different criteria exist for societal risk depending if on-site personnel is affected or if off-site persons are impacted. Some regulations also differentiate between off-site persons being aware of process hazards (for example personnel of another plant next to the facility where the incident occurs) and the general public with less awareness and protective equipment.

Regulations use Frequency-Number (F-N) curves to specify the criteria, in the next diagram I show the criteria for some European countries.

F-N curve showing some differences between European countries

The curve shows the boundaries for societal risk as they are specified within Europe. We can see differences between countries and we can see the new directive within the European union for new plants. Above is very familiar for process safety engineers because this are the limitations that determine their target frequency in LOPA (1E-04 in my example). Some companies can use the less restrictive F-N diagrams for on site personnel, other companies have identified scenarios that might impact the public space and need to follow more restrictive criteria.

In the design of a safety function we typically don’t take the regulatory limit as our target, we add what is called risk capacity by specifying a more restrictive target. So if the regulatory limit would be 1E-03 we might set the target to 1E-04 adding “space” between the risk tolerance limit and acceptable risk limit. Terminology can be sensitive here, specifically the word “acceptable” is a sensitive term for some country’s legal system. Alternatives like Tolerable Acceptable, Tolerable Not Acceptable have been used to sub-divide the area between Not Acceptable and Acceptable. This because a fatality is never acceptable, however since zero risk doesn’t exist we still have to assign fatal incidents with a very low likelihood of occurring an actionable risk level.

The relationship between cyber security risk and societal risk

Though I write these blogs as a private person with a personal opinion and view on cyber security risk, I can not avoid linking this view to my experience build as an employee of Honeywell. The team I work for focuses on cyber security consultancy services and security products for the industry. My first risk assessment was almost 10 years ago in 2012 and I am still involved in risk assessments today.

So almost 10 years of experience working for a major supplier of control and safety solutions, building, maintaining and securing the largest production installations ever build. Working over 40 years for this company in different roles gave me a very detailed insight on how these solutions work and how they are applied to automate production processes. This also gave me detailed insight into a lot of factual data around cyber security risk within plants. Some of these insights I can generalize and discuss in this blog.

Very high level, when we assess cyber security risk (loss based risk) the process is identifying the various system functions, identifying the hazards and their attack scenarios (actually based upon a repository of hundreds of different attack scenarios including their countermeasures and potential functional deviations for almost a 100 different OT systems of different vendors), conducting a criticality and consequence analysis and estimating residual risk based on the countermeasures implemented.

Important information for this blog are the results of the consequence analysis, these results are derived from analyzing the LOPA and HAZOP studies carried out by asset owners. A task of consequence analysis is to go over all identified process safety scenarios and determine if the causes of these scenarios can be the result of a functional deviation of a cyber attack or if the safeguard implemented by the process safety system can be disrupted or used for the attack.

Based upon the results of more than 30 consequence analysis I did it shows that on average between 40 and 60% of all identified process scenarios (identified by HAZOP and LOPA) can also be caused by a cyber attack. So in our example of a pump failure, we can also intentionally cause this by stopping the pump and preventing the SIS to act upon it.

Overall approximately 5% of these “hackable” process scenarios involve fatalities as potential consequence, an even higher percentage of scenarios can cause the highest level of economic loss. This percentage of course differs by plant, there are plants without potential fatalities and there are plants with a much higher percentage of scenarios that result into potential fatalities. Never the less these numbers show that cyber risk in the process industry has a direct relationship with societal risk because a cyber attack can cause this type of incident. An important question is, is the cumulative risk of the process safety risk and cyber security risk below the criteria for societal risk?

There are some important rules and conclusions here to consider:

  • Process scenarios that involve potential fatalities require a safety instrumented function to prevent this. So in principle there should not be any scenario possible where an isolated attack on a BPCS or a failure of a BPCS or process equipment function should result in fatalities. Where ever such scenario is detected in the analysis, it should be corrected.
  • However it is possible that an isolated attack on the safety instrumented system (like the TRITON/TRISIS) attack can cause a scenario resulting in multiple fatalities. This makes the SIS also from a cyber security point of view a very critical system. SIS in this context can be an ESD, BMS, or HIPPS function.
  • The highest impact sensitivity (IS) is scored for attacks that impact both SIS and BPCS. Impact sensitivity being a metric that “weighs” how much “pain” a cyber attack can do by attacking a specific OT function or set of OT functions (e.g. BPCS and SIS).
  • Apart from SIS and BPCS other OT functions with a significant IS score are CCS (compressor control), APC (advanced process control), LIMS (laboratory information), IAMS (instrument asset management), and ASM (analyzer management). For CCS, APC, and ASM this is not surprising. IAMS frequently creates a common point to impact both safety and control while for LIMS we see an increased integration where lab results are transmitted “digitally” to for example the APC. This can create scenarios with a high economic loss since LIMS is directly tight in with product quality.

It is essential for the security of a plant to address cyber security through risk analysis, if the threats and their impact are not known we actually start doing things without knowing if we address the highest risk. Risk analysis should be based on an accurate mapping of the functional deviations caused by a cyber attack against the process scenarios that can result from these attacks. With accurate I mean not using consequence statements such as “Loss of View” or “Loss of Control” these are far to general to be used for this mapping. OT functions have much more specific functional deviations, that can be identified if we have a detailed understanding of the workings of the OT function.

Then the most important question, does the cumulative risk of process safety and cyber security risk meet the regulatory criteria? This is the hardest question to answer because the event frequencies of process safety (based on random failure events) and the event frequencies of cyber security (based on intentional action, and based on skills and motivation) differs very much. Never the less the cumulative event frequency of the two needs to meet the same regulatory limit, as mentioned the societal risk criteria are not specified for process safety they are specified for the production process as a whole. We also know that this cumulative risk is higher than each separate risk, adding new threats doesn’t lower risk and an intentional occurrence has typically a higher event frequency than a random occurrence. If the consequence is the same, the risk will be higher.

To discuss this I need the following diagram.

Threat analysis levels

If we analyze cyber security risk for a plant we typically consider threats at OT function level. The asset, channel and application level is (should be) covered by the design teams during the threat modelling stages of the product development process. However the results at OT function level of this analysis provide an event frequency based on the likelihood of success of the attack. So as if there would be a queue of capable threat actors ready and willing to attack the plant. In a normal situation (so no cyber war) this is not so, threat actors are very selective when it comes to executing targeted attacks specifically if they are very skilled and need advanced methods to succeed.

Therefor not every plant has to fear an attack of a nation sponsored threat actor aiming to cause an attack resulting in serious process impact. Attacks have cost, the cost of a failed attack (e.g. TRITON /TRISIS) are high. To develop such an attack is a considerable investment for a threat actor. This is of course quite different for ransomware attacks with an economic objective, that type of attack is more common. So we always have to consider risk by looking at different threat actors with different motives and capabilities.

For the overall likelihood of a cyber attack two event frequencies are important: the event frequency related to the OT function level threats which depends on the type of threat actor, the TTP, the countermeasures, and the dynamic and static exposure of the OT function; and a second event frequency at management level defining how often such an attack will happen and what threat actors would be interested. The OT function level risk is basically a technical exercise and can be estimated with various risk assessment methodologies, of which methods based on FAIR are used by multiple service providers.

For analyzing management level threats, other factors play a role. Some based on historical occurrences, some driven by geo-politics. Overall a more difficult and subjective factor to assess, typically requiring a threat profiling exercise.
The combination of the two event frequencies (using conditional likelihood formulas because one event depends on the other event) results in an overall event frequency for the cyber security risk. This is the frequency that needs to meet the societal risk criteria when considering loss based risk. At OT function level we can reach reliable results, however this is more difficult at management level.

So does cyber security risk meet the societal risk criteria is a question for which there is no reliable answer.

Another difficulty is that we have different cyber security risk assessment methods, often resulting in different quantitative outcomes. Governments have solved this for process safety by standardizing the estimation of societal risk through enforcing the use of a specific method or tool. However these methods or tools do not consider cyber security risk at this point in time.

Unfortunately none of the standard organizations seems to be willing or able to address this gap. IEC 62443-3-2 is very high level, actually not addressing any of above issues, primarily an introduction on risk. And what I have seen from TR84 it is not much better because it copies IEC 62443-3-2 for a large part and also doesn’t address this legal aspect of process safety and cyber security risk.

But this topic is a gap that needs to be filled, a gap that will be very high on the agenda if a cyber attack occurs with societal impact resulting in multiple fatalities. The TRITON / TRISIS attempt shows that it was merely “luck” and not the result of any impressive cyber security that it didn’t happen.

So maybe an organization like ENISA, that is not organized around volunteers, will consider closing this gap. In order to meet European regulations the gap should be closed.

I hope that people that took the effort to read the blog till the end realize how difficult estimating loss based risk is, and conclude that it might be far easier to use an FMEAC method to estimate risk based on a risk priority number for the security design.

However IEC 62443.3.2 makes the link in its method to the hazop with its loss based impact, so we are driven into considering this complex field of regulations.

I don’t think this is necessary for a good security design, I think it is primarily the result of an attempt to show cyber security is important. What is easier in that case then to link it with big brother process safety, but for proper cyber security design an FMEAC analysis brings us the same results.

So be careful specifying the need for business related risk if some form of legal or financial justification is not required, it opens a can of worms.


There is no relationship between my opinions and references to publications in this blog and the views of my employer in whatever capacity. This blog is written based on my personal opinion and knowledge build up over 43 years of work in this industry. Approximately half of the time working in engineering these automation systems, and half of the time implementing their networks and securing them, and conducting cyber security risk assessments for process installations since 2012.


Author: Sinclair Koelemij

OTcybersecurity web site

Results from the Poll


I started last Friday a small poll to get the opinion of the security community on assigning a security level to a specific type of production process. I selected a refinery, a chemical plant (as example a Poly Propylene plant), a bulk power generation plant and a wind mill farm for power generation.

Apart from people voting for a specific security level, there was also some discussion if the question I asked was correct. And yes it was a tricky question, IEC 62443 never intended to use security levels this way. But never the less IEC 62443.3.3 did create kind of threat actor profile by using the threat actor’s intention, capabilities, resources, and motivation as the differentiator between the security levels. So one could also read the question (and this was my intention) as against what threat actor profile do we need to protect the plant. First let me show the results:

Poll results (8/13/2021 – 8/19/2021)

I leave the security level assignments for what they are, good or bad assignment wouldn’t be an appropriate judgement because the criticality of the production process hasn’t been defined. But we can see in the top two diagrams that there is a certain tendency toward the higher security levels for the selected production processes.

I was also curious if there would be a difference in score between different disciplines, so I divided the votes (452 in total) over 4 groups. The votes from asset owners (135 votes), votes from subject matter experts working for OT service providers (220 votes), votes from subject matter experts working for IT service providers (79 votes), and a number of votes (total 18) of non-related disciplines. Seems like the OT service providers and the asset owners reasonably align in their judgement, and the IT providers and others like the SL 4 score.


Then about the discussion, is the question asked yes or no a valid question? From an IEC 62443 perspective probably not, but if I take the definition of security levels and their relationship with the threat actor profile literally, why not.

But ok, IEC 62443 likes us to define the system in security zones and conduits. Than determine the risk and assign a security level. However there is no transformation matrix defined in the standard. The only transformation matrix I am aware of is in the ISA course material. In the course material a qualitative risk assessment is provided, and the results of this assessment are converted into a security level. But formally there is no defined transformation matrix between risk and security level. Additionally qualitative risk assessments have no link with the quantitative results of the plant’s risk analysis based on the results of their Hazop / LOPA analysis. (See my blog on this topic) A plant’s risk matrix looks like this:

Example risk matrix

In the diagram a plant expresses which risk are acceptable (A), Tolerable Acceptable (TA), Tolerable Non-Acceptable (TNA), or Not acceptable (NA). Horizontally we have the likelihood, generally expressed in events per annum, and vertically we have the consequence severity scores / LOPA target factors. Above example uses 4 risk levels, but also 5 risk levels are used, in a 5 x 5 matrix. But different plants have different matrices and not always 5 x 5, e.g. 7×5 is also quite common aligning with the 7 likelihood categories used in LOPA.

In IEC 62443.3.2 the standard links to loss scenarios such as provided by the HAZOP / LOPA documentation. If we express risk as loss based risk, an important demand of asset owners, the transformation matrix converting risk to SL should align somehow with the risk matrix. But this is a challenge, every plant has its own transformation matrix because a risk seen as Non-Acceptable should not be assigned a security level as SL 2 if the consequence of the process scenario could even be single or multiple fatalities. So we would have many different transformation matrices.

Like I mentioned the ISA course material avoids this issue by working with a qualitative risk assessment and producing outcome that is not aligned with the plant risk matrix. However qualitative risk assessments are a subject matter expert’s opinion, and therefore often very subjective. Especially if workshops don’t have enough participants, and the workshop leader tries to get consensus on the scores. IEC 62443.3.2 denies the existence of quantitative methods, but these methods do exist and are used. I intend to show you how this works in my next blog, but it takes some time to create.


There is no relationship between my opinions and references to publications in this blog and the views of my employer in whatever capacity. This blog is written based on my personal opinion and knowledge build up over 43 years of work in this industry. Approximately half of the time working in engineering these automation systems, and half of the time implementing their networks and securing them, and conducting cyber security risk assessments for process installations since 2012.


Author: Sinclair Koelemij

OTcybersecurity web site

ICS cyber security risk criteria


Abstract

In my previous blog (Why process safety risk and cyber security risk differ) I discussed the differences between process safety risk and cyber security risk and why these two risks don’t align. In this blog I like to discuss some of the cyber security risk criteria, why they differ from process safety risk criteria and how they align with cyber security design objectives. And as usual I will challenge some of IEC 62443-3-2 misconceptions.


Cyber security can be either prescriptive or risk based. An example of a prescriptive approach is the IEC 62443-3-3, the standard is a list with security requirements to follow in order to create resilience against a specific cyber threat. For this IEC 62443 uses security levels with the following definitions:

  • SL 1 – Prevent the unauthorized disclosure of information via eavesdropping or casual exposure.
  • SL 2 – Prevent the unauthorized disclosure of information to an entity actively searching for it using simple means with low resources, generic skills and low motivation.
  • SL 3 – Prevent the unauthorized disclosure of information to an entity actively searching for it using sophisticated means with moderate resources, IACS specific skills and moderate motivation.
  • SL 4 – Prevent the unauthorized disclosure of information to an entity actively searching for it using sophisticated means with extended resources, IACS specific skills and high motivation.

I underlined the criteria that create the difference between the security levels. A few examples to translate the formal text from the standard to what is happening in the field.

An example of an SL 1 level of resilience is protection against a process operator looking over the shoulder of a process engineer to retrieve the engineer’s password. Maybe you don’t consider this a cyber attack, but formally it is a cyber attack by a hopefully non-malicious insider.

An example of an SL 2 level of resilience is protection against malware, for example a process control system that became infected by WannaCry, ransomware. WannaCry didn’t target specific asset owners and did not specifically target process control systems. Any system with an exposed Microsoft EternalBlue vulnerability could become victim.

An example of an SL 3 level of resilience is protection against the attack on Ukraine’s power power grid. This was a targeted attack, using a mixture of standard tactics like phishing to get access to the system and specially crafted software to make modifications in the control system.

An example of an SL 4 level of resilience would be the protection against Stuxnet, the attack on Iran’s uranium enrichment facilities. This attack made use of zero-day vulnerabilities, required detailed knowledge of the production process, and thoroughly testing of the attack on a “copy” of the actual system.

The difference between SL 2 and SL 3 is clear, however the difference between SL 3 and SL 4 is a bit arbitrary. For example is the Triton attack an example of SL 3 or can we say it is SL 4. The Triton attack required like Stuxnet also a significant investment for the threat actors. But where Stuxnet had clear political motives, the motives for the Triton attack are less clear for me. SL 4 is often linked to resilience against attacks by nation-states, but with all these “nation state sponsored” threat actors that difference often disappears.

The IEC 62443-3-3 standard assigns the security levels to security zones and conduits of the control system for defining the technical security requirements for the assets in the zone and communication between zones. The targets for a threat actor are either an asset or a channel (the protocols flowing through the conduit). Though the standard also attempts to address risk with the IEC 62443-3-2, there is no clear path from risk to security level. There is not an “official” transformation matrix that converts a specific risk level into a security level, apart from the many issues with such a matrix. So overall IEC 62443-3-3 is a prescriptive form of cyber security. This is common for standards and government regulations, they need clear instructions.

The issue with prescriptive cyber security is that it doesn’t address the specific differences between systems. It is kind of ready-to-wear suit, does overall a good job but a tailor-made suit fits better. The tailor-made suit for cyber security is risk based security. In my opinion risk based security is a must for process automation systems supporting the critical infrastructure. Threat actors targeting critical infrastructure are highly skilled professionals, we should not put them aside as hackers for fun. Also the offensive side is a profession, either servicing a “legal” business such as the military or an “illegal” business such as cyber crime. And this cybercrime business is big business, it is for example bigger than the drugs trade.

Protection against the examples I gave for SL 3 and SL 4 requires a detailed analysis of the attack scenarios available to launch against the process installation, analyzing which barriers are in place to stop or detect these scenarios, and estimating the residual risk after having applied the barriers to see if we meet the risk criteria. For this we need residual risk, the risk after applying the barriers, and residual risk requires quantitative risk analysis to estimate the risk reduction similar to how process safety does this with LOPA as discussed in my previous blog.

Quantitative analysis is required because we want to know the contribution in risk reduction from the various barriers. Barriers being the countermeasures with which we can reduce the likelihood that the attack succeeds or with which we reduce / take away the impact severity of the consequences of a successful cyber attack. A simple example of a likelihood reducing barrier is an antivirus solution, a simple example of an impact severity reducing barrier is a back-up. These barriers are not limited to various security packages but also include design choice in the automation system and the production facility. The list of barriers I work with during my professional time has grown to over 400 and keeps growing with every detailed risk assessment. The combination of attack scenarios (the TTP of the threat actors), barriers and consequences (the deviations of the process automation functions as result of a successful cyber attack) is the base for a risk analysis.

Where a value for consequence severity can either be a subject matter expert assigned severity level for the functional deviation (resulting in a risk priority number (RPN)) or the severity scores / target factors of the worse case process scenarios that can result from the potential functional deviation. These severity scores / target factors come from the HAZOP or LOPA sheets created by the process safety engineers during their analysis of what can go wrong with the process installation and what is required to control the impact when things go wrong. When we use LOPA / HAZOP severity scores for consequence severity we call the resulting risk loss based risk (LBR), the risk a specific financial, safety, or environmental loss occurs. For security design a risk priority number is generally sufficient to identify the required barriers, however to justify the risk mitigation (investment in those barriers) to management and regulatory organizations loss based risk is often a requirement.

To carry out a detailed risk assessment the risk analyst should oversee a wide field of skills, understanding the automation system’s working in detail, understanding the process and safety engineering options, and understanding risk. Therefore risk assessments are teamwork of different subject matter experts, however the risk analyst needs to connect all input to get the result.

But risk assessments is also a very rewarding cyber security activity because communicating risk to management is far easier than explaining them why we invest in a next generation firewall instead of the lower cost packet filter. Senior management understands risk far better than cyber security technology.


So far the intro, lets look at the risk criteria now. ISA / IEC have a tendency in their approach to cyber risk to have a So much for the intro, now let’s look at the risk criteria. ISA/IEC tend to look closely at how process security approaches the subject in their approach to cyber risk and to attempt to copy it.

However as explained in my previous blog there are major differences between cyber security risk and process safety risk making such a comparison more complex than it seems. Many of these differences also have an impact on the risk criteria and the terminology we use. I like to discuss two terms in this blog, unmitigated risk and risk tolerance. Let’s start with unmitigated risk.

Both ISA 62443-3-2 and the ISA TR 84 work group use the term unmitigated risk. As an initial action they want to determine unmitigated risk and compare this with the risk criteria. Unmitigated risk is a term used by process safety for the process safety risk prior to applying the safeguards protecting against randomly occurring events that could cause a specific worse case process impact. The safeguards protect against events like a leaking seal, a failing pump, or an operator error. The event frequency of such an initiating event (e.g. failed pump) is reduced by applying safeguards, the resulting event frequency after applying the safeguard needs to meet specified limits. (See my previous blog) Safety engineers basically reduce an event frequency gap using safeguards with a reliability that actually accomplish this. The safeguard will bring the process into a safe state by itself. Multiple safeguards can exist but each safeguard will prevent the worst case consequence by itself. It is not that safeguard 1 and safeguard 2 need to accomplish the job together, each of them individually does the job. There might be a preferred sequence but not a dependency of protection layers.

Cyber security doesn’t work that way, we might define a specific initiating event frequency for the chance on a virus infection. But after installing an antivirus engine we cannot say the problem is solved and no virus infections will occur. The reliability of a process safety barrier is an entirely different factor than the effectiveness of a cyber security barrier. Both reduce risk, the process safety barrier reduces the risk to the required limit by it self with a reliability that allows us to take the credit for the risk reduction. But the cyber security barrier most likely requires additional barriers to reach an acceptable event frequency / risk reduction.

Another difference is that in cyber security the initiating event is not occurring randomly, it is an intentional action of a threat actor with a certain propensity (A term introduced by Terry Ingoldsby from Amenaza) to target the plant, select a TTP and target a specific function. The threat actor has different TTPs available to accomplish the objective, so the initiating event frequency is not so much one point on the frequency scale but a range with a low and high limit. We cannot pick on forehand the high limit of this range (representing the highest risk) because the process control system’s cyber resilience actually determines if a specific TTP can succeed, so we need to “exercise” a range of scenarios to determine the highest event frequency (highest likelihood) applicable within the range.

A third difference is the defense in depth. In process safety defense in depth is implemented by multiple independent protection layers. For example there might be a safety instrumented function configured in a safety system, but additionally there can be physical protection layers like a dike or other forms of bunding to control the impact. In cyber security we also apply defense in depth, it is considered bad practice if security depends on a single control to protect the system. However many of these cyber security controls share a common element, the infrastructure / computer. We can have an antivirus engine and we can add application whitelisting or USB protection to further reduce the chance that malware enters the system but they all share the same computer platform offering a shared point of failure.

Returning to the original remark on unmitigated risk, in process automation cyber security risk unmitigated risk doesn’t exist. The moment we install a process control system we install some inherent protection barriers. Examples are authentication / authorization, various built-in firewalls, encrypted messages, etc. So when we start a cyber security risk analysis there is no unmitigated risk, we can’t ignore the various barriers built-in the process automation systems. A better term to use is therefore inherent risk. The risk of the system as we analyze it, the inherent risk is also the residual risk but it is not unmitigated there is a range of barriers implemented when we start a risk analysis. The question is more, does the inherent risk meet the risk criteria and if not what barriers are required that result in a residual risk that does meet the criteria.


The second term I like to discuss is risk tolerance. Both IEC 62443 and the ISA TR 84 work group pose that the cyber security must meet the risk tolerance. I fully agree with this, where we differ is that I don’t see risk tolerance as the cyber security design target where the IEC 62443 standard does. In risk theory, risk tolerance is defined as the maximum loss a plant is willing to experience. To further explain my issue with the standard I first discuss the process safety side use of risk tolerance and use an F-N diagram from my previous blog.

Example F-N diagram

This F-N curve shows two limits using a red and a green line. Anything above the red line is unacceptable, anything below the green line is acceptable. The area between the two lines is considered tolerable if it meets the ALARP (As Low As Reasonably Practicable) principle. For a risk to be ALARP, it must be possible to demonstrate that the cost involved in reducing the risk further would be grossly disproportionate to the benefit gained. Determining that a risk is reduced to the ALARP level involves an assessment of the risk to be avoided, an assessment of the investment (in money, time and trouble) involved in taking measures to avoid that risk, and a comparison of the two.

In process safety where the events occur randomly this is possible, in cyber security where the events occur intentionally this is far more difficult.

Can we consider the risk for the power grid in a region with political tensions the same as in the case of a region having no conflicts at all. I worked for refineries that had as a requirement to be resilient against SL 2 level of threat actors, but also refineries that told me they wanted SL 3, and there was even a case where the requirement was SL 4. So in cyber security the ALARP principle is not really followed, there is apparently another limit. The risk tolerance limit is for all the same, but there is also a limit that sets a kind of cyber security comfort level. This level we call the risk appetite, and this level is actually should become our cyber security design target level.

Risk appetite and risk tolerance shouldn’t be the same, there should be a margin between the two that allow for the possibility to respond to failures of the security mechanisms. If risk appetite and risk tolerance are the same and this would also be our design target any issue with a security control would result in an unacceptable risk.

In principal unacceptable risk means we should stop the production (as is the case for process safety), so if the limits would be the same we have created kind of a on/off mechanism. For example if we couldn’t update our antivirus engine for some reason, risk would raise above the limit and we would need to stop the plant. Maybe an extreme example and certainly not really a situation I see happening in real life. However when risk becomes not acceptable we should have an action defined for this case. There are plants that don’t have a daily update but follow a monthly or quarterly AV signature update frequency (making AV engine effectiveness very low with all the polymorph viruses), so apparently risk appetite differs.

If we want to define clear actions / consequences for each risk level we need sufficient risk levels to do this and limits that allow us to respond to failing cyber controls. So we need two limits, risk appetite and risk tolerance. The difference between risk appetite and risk tolerance is called risk capacity, having a small risk capacity means that issues can escalate quickly. A security design must also consider the risk capacity in the selection of barriers, “defense in depth” is an important security principle here because this increases risk capacity.

Example risk matrix

Above shows an example risk matrix (different criteria as the F-N diagram above) with 4 risk levels (A, TA, TNA, NA). Typically 4 or 5 risk levels are chosen and for each level the criteria and action is specified. In above example the risk tolerance level is the line that separates TNA and NA. Risk appetite might be either the line between TA and TNA or between A and TA for a very risk averse asset owner. However the risk capacity of a security design were the risk appetite is defined at the TA / TNA border is much smaller than if our target would be the A / TA border. But in both cases a risk increase due to the failure of a cyber security control with not immediately escalate into a Non Acceptable risk condition.

If we opt for risk based security, we need to have actionable risk levels and in that case a single risk tolerance level as specified and discussed in the IEC 62443-3-2 is just not possible and therefore not practiced for cyber security risk. The ALARP principle and cyber security don’t go together very well.


Maybe a bit boring topic, maybe too much text, never the less I hope the reader understands why unmitigated risk doesn’t exist in cyber security for process automation. And I certainly hope that the reader will understand that the risk tolerance limit is a bad design target.


There is no relationship between my opinions and references to publications in this blog and the views of my employer in whatever capacity. This blog is written based on my personal opinion and knowledge build up over 43 years of work in this industry. Approximately half of the time working in engineering these automation systems, and half of the time implementing their networks and securing them, and conducting cyber security risk assessments for process installations since 2012.


Author: Sinclair Koelemij

OTcybersecurity web site

Why process safety risk and cyber security risk differ


Abstract

When cyber security risk for process automation systems is estimated I often see references made to process safety risk. This has several reasons:

  • For estimating risk we need likelihood and consequence, the process safety HAZOP and LOPA processes used by plants to estimate process safety risk, identify the consequence of the process scenarios they identify and analyze. These methods also classify the consequence in different categories such as for example finance, process safety, and environment.
  • People expect a cyber security risk score that is similar to the process safety risk score, a score expressed as loss based risk. The idea is that the cyber threat potentially increases the process safety risk and they like to know how much that risk is increased. Or more precisely how high is the likelihood that the process scenario could occur as result of a cyber attack.
  • The maturity of the process safety risk estimation method is much higher than the maturity of cyber security risk estimation methods in use. Not that strange if you consider that the LOPA method is about 20 years old, and the HAZOP method goes back to the end sixties. When reading publications, or even the standards on cyber security risk (e.g. IEC 62443-3-2) this lack of maturity is easily detected. Often qualitative methods are selected, however these methods have several drawbacks which I discuss later.

This blog will discuss some of these differences and immaturities. I’ve done this in previous blogs mainly by comparing what the standards say and what I’ve experienced and learned over the past 8 years as a cyber risk analysis practitioner for process automation systems doing a lot of cyber risk analysis for the chemical, and oil and gas industries. This discussion requires some theory, I will use some every day examples to explain to make it more digestible.


Let us start with a very important picture to explain process safety risk and its use, but also to show how process safety risk differs from cyber security risk.

Process safety FN curve

There are various ways to express risk, the two most used are risk matrices and FN plots / FN curve. FN curves require a quantitative risk assessment method, such as used in process safety risk analysis by for example LOPA. In an FN curve we can show the risk criteria. The boundaries for what we consider acceptable risk and what we consider unacceptable risk. I took a diagram that I found on the Internet where we have a number of process safety scenarios (shown as dots on the blue line) their likelihood of occurrence ( the vertical ax) and in this case the consequence expressed in fatalities when such a consequence can happen (horizontal ax). The diagram is taken from a Hydrogen plant, these plants belong to the most dangerous plants, this is why we see the relative high number of scenarios with a single or multiple fatalities.

Process safety needs to meet regulations / laws that are associated with their plant license. One such “rule” is that the likelihood of “in fence” fatalities must be limited to 1 every 1000 years (1.00E-3) If we look at the risk tolerance line (RED) in the diagram we see that what is considered tolerable and intolerable is exactly at the point where the line crosses the 1.00E-03 event frequency (likelihood). Another often used limit is the 1.00E-04 frequency for the limit used as acceptable risk, risk not further addressed.

How does process safety determine this likelihood for a specific process scenario? In process safety we have several structured methods for identifying hazards. One of them is the Hazard and Operability study, in short the HAZOP. In a hazop we analyze, for a specific part of the process, if specific conditions can occur. For example we can take the flow through an industrial furnace and analyze if we can have a high flow, no flow, maybe reverse flow. If such a condition is possible we look at the cause of this (the initiating event), perhaps no flow because a pump fails. If we have established the cause (the initiating event) we consider what would be the process consequence. Well possibly the furnace tubing will be damaged, the feed material would leak into the furnace and an explosion might occur. This is what is called the process consequence. This explosion has an impact on safety, one or multiple field operators might be in the neighborhood and killed by the explosion. There will also be a financial impact, and possibly an environmental impact. A hazop is a multi-month process where a team of specialists goes step by step through all units of the installation and considers all possibilities and ways how to mitigate this hazard. This results in a report with all analysis results documented and classified. Hazops are periodically reviewed in a plant to account for possible changes, this we call the validity period of the analysis.

However we don’t have yet a likelihood expressed as an event frequency such as used in the FN curve. This is where the LOPA method comes in. LOPA has tables for all typical initiating events (causes), so the event frequency for the failure of a pump has a specific value (for example 1E-01, once every 10 years). How were these tables created? Primarily based on statistical experience. These tables have been published, but can also differ between companies. It is not so that a poly propylene factory of company A uses by default the same tables as a poly propylene factory of company B. All use the same principles, but small differences can occur.

In the example we have a failing pump with an initiating frequency of once every 10 years and a process consequence that could result in a single fatality. But we also know that our target for single fatalities should be once per 1000 years or better. So we have to reduce this event frequency of 1E-01 with at least a factor 100 to get to once per 1000 years.

This is why we have protection layers, we are looking for one or more protection layers that offer us a factor one hundred extra protection. One of these protection layers can be the safety system, for example a safety controller that detects the no flow condition by measuring the flow and shuts down the furnace to a safe state using a safety valve. How much “credit” can we take for this shutdown action? This depends on the safety integrity level (SIL) of the safety instrumented function (SIF) we designed. This SIF is more than the safety controller where the logic resides, the SIF includes all components necessary to complete the shutdown function, so will include transmitters that measure the flow and safety valves that close any feed lines and bring other parts of the process into a safe condition.

We assign a SIL to the SIF. We typically (SIL 4 does exist) have 3 safety integrity levels: SIL 1, 2, and 3. According to LOPA a SIL 1 SIF gives us a reduction of a factor 10, SIL 2 will reduce the event frequency by a factor 100, and SIL 3 by a factor 1000.

How do we estimate if a SIF meets the requirements for SIL 1, 2, or 3? This requires us to estimate the average probability of failure on demand for the SIF. This estimation makes use of mean time between failure of the various components of the SIF and the test frequency of these components. For this blog I skip this part of the theory, we don’t have to go into that level of detail. High level we estimate what we call the probability of failure on demand for the protection layer (the SIF). In our example we need a SIF with a SIL 2 rating, a protection level relatively easy to create.

In the FN curve you can also see process scenarios that require more than a factor 100, for example a factor 1000 like in a SIL 3 SIF. This requires a lot more, both from the reliability of the safety controller as well as from the other components. Maybe a single transmitter is not reliable enough anymore and we need some 2oo3 (two out of three) configuration to have a reliable measurement. Never the less the principle is the same, we have some initiating event, we have one or more protection layers capable of reducing the event frequency with a specific factor. These protection layers can be a safety system (like in my example), but also some physical device (e.g. pressure relief valve), an alarm from the control system, an operator action, a periodic preventive maintenance activity, etc. LOPA gives each of these protection layers what is called a credit factor, a factor with which we can reduce the event frequency when the protection layer is present.

So far the theory of process safety risk,. One topic I avoided discussing here is the part where we estimate the probability of failure on demand (PFDavg) for a protection layer. But it has some relevance for cyber risk estimates. If we would go into more detail and discuss these formulas to estimate the effectiveness / reliability of the protection layer we see that the formulas for estimating PFDavg we depend on what is called the demand rate. The demand rate is the frequency which we expect the protection layer will needs to act.

The standard (IEC 61511) makes a difference between what is called low-demand rate and high / continuous demand rate. The LOPA process is based upon the low demand-rate formulas, the tables don’t work for high / continuous demand rate. This is an important point to notice when we start a quantitative cyber risk analysis because the demand rate of a cyber protection layer is by default a high / continuous demand rate type of protection layer. This difference impacts the event frequency scale and as such the likelihood scale. So if we were to estimate cyber risk in a similar manner as we estimated process safety risk we end up with different likelihood scales. I will discuss this later.


A few important points to note from above discussion:

  • Process safety risk is based on randomly occurring events, events based on things going wrong by accident, such as a pump failure, a leaking seal, an operator error, etc.
  • The likelihood scale of process safety risk has a “legal” meaning, plants need to meet these requirements. As such a consolidated process safety and cyber security risk score is not relevant and because of estimation differences not even possible.
  • When we estimate cyber security risk, the process safety risk is only one element. With regard to safety impact the identified safety hazards will most likely be as complete as possible, but the financial impact will not be complete because financial impact might also result from scenarios that do not impact process operations but might impact the business. The process safety hazop or LOPA does not generally address cyber security scenarios for systems that have no potential process impact, for example a historian or metering function.
  • The IEC 62443 standard tries to introduce the concept of “essential” functions and ties these functions directly to the control and safety functions. However plants and automation functions have many essential tasks not directly related to the control and safety functions, for example various logistic functions. The automation function contains all functions connected to level 0, level 1, level 2, level 3, and demilitarized zone. When we do a risk analysis these systems should be included, not just the control and safety elements. The problem that a ship cannot dock to a jetty also has significant cost to consider in a cyber risk analysis.
  • Some people suggest that cyber security provides process safety (or worse the wider safety is even suggested.) This is not true, process safety is provided by the safety systems. The various protection layers in place. Cyber security is an important condition for these functions to do their task, but not more as a condition. The Secret Service protects the president of the US against various threats, but it is the president of the US that governs the country – not the Secret Service by enabling the president to do his task.

Where does cyber security risk differ from process safety risk? Well first of all they have different likelihood scales. Process safety risk is based on random events, cyber security risk is based on intentional events.

Then there is the difference that a process safety protection layer always offers full protection when it is executed, many cyber security protection layers don’t. We can implement antivirus as a first protection layer, application white listing as a 2nd protection layer, they both would do their thing but still the attacker can slip through.

Then there is the difference that a cyber security protection layer is almost continually “challenged”, where in process safety the low demand rate is most often applied, which sets the maximum demand rate to once a year.


If we would look toward cyber security risk in the same way as LOPA does toward process safety risk, we could define various events with their initiating event frequency. For example we could suggest an event such as a malware infection to occur bi-annually. We could assign protection layers against this, for example anti-virus and assign this protection layer a probability of failure on demand (risk reduction factor), so a probability on a false negative or false-positive. If we have an initiating event (the malware infection) with a certain frequency and a protection layer (antivirus) with a specific reduction factor we can estimate a mitigated event frequency (of course taking high demand rate into account).

We can also consider multiple protection layers (e.g. antivirus and application white listing) and arrive at a frequency representing the residual risk after applying the two protection layers. Given various risk factors and parameters to enter the system specific elements and given a program that evaluates the hundreds of attack scenarios, we can arrive at a residual risk for one or hundreds of attack scenarios.

Such methods are followed today, not only by the company I work for but also by several other commercial and non-commercial entities. Is it better or worse than a qualitative risk analysis (the alternative)? I personally believe it is better because the method allows to take multiple protection layers into account. Is it actuarial type of risk, no it is not. But the subjectivity of a qualitative assessment has been removed because of the many factors determining the end result and we have risk now as residual risk based upon taking multiple countermeasures into account.

Still there is another difference between process safety and cyber security risk not accounted for. This is the threat actor in combination with his/her intentions. In process safety we don’t have a threat actor, all is accidental. But in cyber security risk we do have a threat actor and this agent is a factor that influences the initiating event frequency of an attack scenario.

The target attractiveness of facilities differ for different threat actors. A nation state threat actor with all its capabilities is not likely to attack the local chocolate cookie factory, but might show interest in an important pipeline. Different threat actors mean different attack scenarios to include but also influence the initiating event frequency it self. Where non-targeted attacks show a certain randomness of occurrence, a targeted attack doesn’t show this randomness.

We might estimate a likelihood for a certain threat actor to achieve a specific objective for the moment that the attack takes place, but this start moment is not necessarily random. Different factors influence this, so to express cyber risk on a similar event frequency scale as process safety risk is not possible. Cyber security risk is not based on the randomness of the event frequencies. If there is a political friction between Russia and Ukraine, the amount of cyber attacks occurring and skills applied is much bigger than in times without such a conflict.

Therefore cyber security risk and process safety risk cannot be compared. Though the cyber threat certainly increases the process safety risk (both initiating event frequency can be higher and the protection layer might not deliver the level of reliability expected), we can not express this rise in process safety risk level because of the differences discussed above. Process safety risk and cyber security risk are two different things and should be approached differently. Cyber security has this “Secret Service” role, and process safety this “US president” role. We can estimate the cyber security risk that this “Secret Service” role will fail and the US government role is made to do bad things, but that is an entirely different risk than that the US government role will fail. It can fail even when the “Secret Service” role is fully active and doing its job. Therefore cyber security risk has no relation with process safety risk, they are two entirely different risks. The safety protection layers provide process safety (resilience against accidental failure), the cyber security protection layers provide resilience against an intentional and malicious cyber attack.


There is no relationship between my opinions and references to publications in this blog and the views of my employer in whatever capacity. This blog is written based on my personal opinion and knowledge build up over 43 years of work in this industry. Approximately half of the time working in engineering these automation systems, and half of the time implementing their networks and securing them, and conducting cyber security risk assessments for process installations since 2012.


Author: Sinclair Koelemij

OTcybersecurity web site

Cyber risk assessment is an exact business

Abstract


This blog is about risk assessment in cyber physical systems and some of the foundational principles. I created several blogs on the topic of risk assessment before, for example “Identifying risk in cyber physical systems” and “ISA 62443-3-2 an unfettered opinion“. Specifically the one on criticizing the ISA standard caused several sharp reactions. In the meantime ISA 62443-3-2 has been adopted by the IEC and a task group focusing on cyber security and safety instrumented systems (ISA 84 work group 9) addresses the same topic. Though unfortunately the ISA 84 team seems to have the intention to copy the ISA 62443-3-2 work and with this also the structural flaws will enter the work of this group. One of these flaws is the ISA approach toward likelihood.

Therefore this blog addresses this very important aspect of a risk assessment in the cyber physical system arena. Likelihood is actually the only factor of interest, because the impact (severity of the consequences) is a factor that the process hazard analysis the asset owner makes provides. Therefore likelihood / probability is the most important and challenging variable to determine because many of the cyber security controls affect the likelihood of a cyber security hazard occurring. Much of the risk reduction is achieved by reducing the chance that a cyber attack will succeed through countermeasures.

Having said this about likelihood we must not ignore the consequences, as I have advocated in previous blogs. This because risk reduction through “cyber safeguards” (those barriers that either eliminate the possibility of a consequence occurring or reduce the severity of that consequence – see my earlier blogs) is often a more reliable risk reduction than “cyber countermeasures” (those barriers that reduce the likelihood).

But this blog is about likelihood, the bottlenecks we face in estimating the probability and selecting the correct quantitative scale to allow us to express a change in process safety risk as the result of the cyber security threat.

At the risk of losing readers before coming to the conclusions, I would still like to cover this topic in the blog and explain the various problems we face. If you are interested in risk estimation I suggest to read it, if not just forward it to stalk your enemies.


Where to start? It is always dangerous to start with a lot of concepts because for part of the audience this is known stuff, while for others it answers some questions they might have. I am not going to give much formulas, most of these have been discussed in my earlier blogs, but it is important to understand there are different forms of risk. These forms often originate from different questions we like to answer. For example we have:

  • Risk priority numbers (RPN), is a risk value used for ranking / prioritization of choices. This risk is a mathematical number, the bigger the number the bigger the risk;
  • Loss based risk (LBR), is a risk used for justifying decisions. This risk is used in production plants and ties the risk result to monetary loss due to production outage / equipment damage / permit to operate. Or a loss expressed in terms of human safety or environmental damage. Often risk is estimated for multiple loss categories;
  • Temporal risk or actuarial risk, is a risk used for identifying the chance on a certain occurrence over time. For example insurance companies use this method of risk estimation analyzing for example the impact of obesity over a 10 year period to understand how it impacts their cost.

There are more types of risk than above three forms, but these three cover the larger part of the areas where risk is used. The only two I will touch upon in this blog, are RPN and LBR. Temporal risk, the question of how many cyber breaches caused by malware will my plant face in 5 years from now, is not raised today in our industry. Actually at this point in time (2021) we couldn’t even estimate this because we lack the statistical data required to answer the question.

We like to know what is the cyber security risk today, what is my financial, human safety, and environmental risk, can it impact my permit to operate, and how can I reduce this risk in the most effective way? What risk am I willing to accept and what should I keep a close eye on, and what risk will I avoid? RPN and LBR estimates are the methods that provide an answer here and both are extensively used in the process industry. RPN primarily in asset integrity management and LBR for business / mission risk. LBR is generally derived from the process safety risk, but business / mission risk is not the same as process safety risk.


Risk Priority Numbers are the result of what we call Failure Mode Effect and Criticality Analysis (FMECA) a method applied by for example asset integrity management. FMECA was developed by the US military over 80 years ago to change their primarily reactive maintenance processes into proactive maintenance processes. The FMECA method focuses on qualitative and quantitative risk identification for preventing failure, if I would write “for preventing cyber failure” I create the link to cyber security.

For Loss Based Risk there are various estimation methods used (for example based on annual loss expectancy), most of them very specific for a business and often not relevant or not applied in the process industry. The risk estimation method mostly used today in the process industry, is the Layers Of Protection Analysis (LOPA) method. This method is used extensively by the process safety team in a plant. The Hazard and Operability (HAZOP) study identifies the various process hazards, and LOPA adds risk estimation to this process to identify the most prominent risks.

If we know what process consequences can occur (for example a seal leak causing an exposure to a certain chemical, yes / no potential ignition, how many people would be approximately present in the immediate area, is the exposure yes / no contained within the fence of the plant, etc.) we can convert the consequence into a monetary/human safety/environmental loss value. This together with the LOPA likelihood estimate, results in a Loss Based Risk score.

How do we “communicate” risk, well generally in the form of a risk assessment matrix (RAM). A matrix that has a likelihood scale, an impact scale and shows (generally using different colors) what we see as acceptable risk, tolerable risk, and not acceptable risk zones. But other methods exist, however the RAM is the form most often used.


A picture of a typical risk assessment matrix with 5 different risk levels and some criteria for risk appetite and risk tolerance. And a picture to have at least one picture in the blog.

So much for the high-level description, now we need to delve deeper into the “flaws” I mentioned in the introduction / abstract. Now that the going gets tough, I need to explain the differences between low demand mode and high demand / continuous mode as well as the differences between IEC 61511 and IEC 62061 and some differences in how the required risk reduction is estimated, but also how the frequency of events scale ,underlying the qualitative likelihood scale, plays a role in all this. This is a bit of a chicken and egg problem, we need to understand both before understanding the total. Let me try, I start with taking a deeper dive into process safety and the safety integrity limit – the SIL.


In process safety we start with what is called the unmitigated risk, the risk inherent to the production installation. This is already quite different from cyber security risk, where unmitigated risk would be kind of a foolish point to start. Connected to the Internet and without firewalls and other protection controls, the process automation system would be penetrated in milli-seconds by all kind of continuous scanning software. Therefor in cyber security we generally start with residual risk based upon some initial countermeasures and we investigate if this risk level is acceptable / tolerable. But let’s skip a discussion on the difference between risk tolerance and risk appetite, a difference ignored by IEC 62443-3-2 though from a risk management perspective an essential difference that provides us time to manage.

However in plants the unmitigated situation is relevant, this has to do with what is called the demand rate and that we don’t analyze risk from a malicious / intentional perspective. Incidents in process safety are accidental, caused by wear and tear of materials and equipment, human error. No malicious intent, in a HAZOP sheet you will not find scenarios described where process operators intentionally open / close valves in a specific construction/sequence to create damage. And typically most hazards identified have a single or sometimes a double cause, but not much more.

Still asset owners like to see cyber security risk “communicated” in the same risk assessment framework as the conventional business / mission risk derived from process hazard analysis. Is this possible? More to the point, is the likelihood scale of a cyber security risk estimate the same as the likelihood scale of a process safety risk estimate if we take the event frequencies underlying the often qualitative scales of the risk diagrams into account?

In a single question, would the qualitative likelihood score of Expected for a professional boxer to go knock out (intentional action) during the job during his career, be the same as for a professional accountant (accidental)? Can we measure these scales along the same quantitative event frequency scales? I don’t think so. Even if we ignore for a moment the difference in career length, the probability that the accountant goes knock out (considering he is working for a reputable company) during his career is much lower. But the IEC/ISA 62443-3-2 method does seem to think we can mix these scales. But okay, this argument doesn’t necessarily convince a process safety or asset integrity expert, even though they came to the same conclusion. To explain I need to dive a little deeper into the SIL topic in the next section and discuss the influence of another factor, demand rate, on the quantitative likelihood scale.


The hazard (HAZOP) and risk assessment (LOPA) are used in process safety to define the safety requirements. The safety requirements are implemented using what are called Safety Instrumented Functions (SIF). The requirements for a SIF can be seen as two parts:

  • Safety function requirements;
  • Safety integrity requirements;

The SIFs are implemented to bring the production process to a safe state when demands (hazardous events) occur. A demand is for example if the pressure in a vessel rises above a specified limit, the trip point. The safety functional requirements specify the function and the performance requirements for this function. For example the SIF must close an emergency shutdown valve the “Close Flow” function, performance parameters can be the closing time and the leakage allowed in closed position. For this discussion the functional requirements are not that important, but the safety integrity requirements are.


When we discuss safety integrity requirements, we can split the topic into four categories:

  • Performance measures;
  • Architectural constraints;
  • Systematic failures;
  • Common cause failures.

For this discussion the performance measures, expressed as the Safety Integrity Level (SIL), are of importance. For the potential impact of cyber attacks (some functional deviation or lost function) the safety function requirements (above), and the common cause failures, architectural constraints, and systematic failures are of more interest. But the discussion here focuses on risk estimation and more specific the likelihood scale not so much on how and where a cyber attack can cause process safety issues. Those scenarios can be discussed in another blog.

The safety integrity performance requirements define the area I focus on, in these requirements safety integrity performance is expressed as a SIL. The IEC 61508 defines 4 safety integrity levels: SIL 1 to SIL 4. SIL 4 having the most strict requirements. To fulfill a SIL, the safety integrity function (SIF) must meet both a quantitative requirement and a set of qualitative requirements.

According to IEC 61508 the quantitative requirement is formulated based on either an average probability of failure on demand (PFDavg) for what are called low demand SIFs, and a Probability of Failure on Demand per Hour (PFH) high demand / continuous mode SIFs. Two different event frequency scales are defined, one for the low demand SIFs and one for the high demand SIFs. So depending on how often the protection mechanism is “challenged” the risk estimation method will differ.

For the low demand SIFs the SIL expresses a range of risk reduction values, and for the high demand SIFs it is a scale of maximum frequency of dangerous system failures. Two different criteria, two different methods / formulas for estimating risk. If the SIF is demanded less than once a year, low-demand mode applies. If the SIF is demanded more than once a year high demand / continuous mode is required. The LOPA technique for estimating process safety risk is based upon the low-demand mode, the assumption that the SIF is demanded less than once a year. If we would compare our cyber security countermeasure with a SIF, will our countermeasure be demanded just once a year? An antivirus countermeasure is demanded every time we write to disk, not to mention a firewall filter passing / blocking traffic. Risk estimation for cyber security controls is high demand / continuous mode.

LOPA specifies a series of initiating event frequencies (IEF) for various occurrences. These event frequencies can differ between companies, but with some exceptions they are similar. For example the IEF for a control system sensor failure can be set to once per 10 year, and the IEF for unauthorized changes to the SIF can be set to 50 times per year. These are actual examples for a chemical plant, values from the field not an example made up for this blog. The 50 seems high, but by giving it a high IEF it also requires more and stronger protection layers to reduce the risk within the asset owner’s acceptable risk criteria. So there is a certain level of subjectivity in LOPA possible, which creates differences between companies for sometimes the same risk. But most of the values are based on statistical knowledge available in the far more mature process safety discipline compared with the cyber security discipline.

In LOPA the IEF is reduced using protection layers (kind of countermeasure) with a specific PFDavg. PFDavg can be a calculated value, carried out for every safety design, or a value selected from the LOPA guidelines, or an asset owner preferred value.

For example an operator response as protection layer is worth a specific factor (maybe 0.5), so just by having an operator specified as part of the protection layer (maybe a response to an alarm) the new frequency, the Mitigated Event Frequency (MEF), for the failed control system sensor becomes 0.5 x 10 equivalent to once per 5 years. Based upon one or more independent protection layers with their PFD, the IEF is reduced to a MEF. If we create a linear scale for the event frequency and sub-divide the event scale in a number of equal qualitative intervals to create a likelihood scale, we can estimate the risk given a specific impact of the hazardous event. The linearity of the scale is important since we use the formula risk equals likelihood times impact, if the scale would be logarithmic the multiplication wouldn’t work anymore.

In reality the LOPA calculation is a bit more complicated because we also take enabling factors into account, probability of exposure, and multiple protection layers (including BPCS control action, SIF, Operator response, and physical protection layers such as brake plates and pressure relief valves). But the principle to estimate the likelihood remains a simple multiplication of factors. However LOPA applies only for the low demand cases and LOPA is using an event scale based on failures of process equipment and human errors. Not an event scale that takes into account how often a cyber asset like an operator station gets infected by malware, not taking into account intentional events, and starts with the unmitigated situation. Several differences with risk estimation for cyber security failures.


Most chemical and refinery processes follow LOPA and qualify for low-demand mode, with a maximum demand for a SIF of once a year. However in the offshore industry there is a rising demand for SIL based on high demand mode. Also in the case of machinery (IEC 62061) a high demand / continuous mode is required. Using high demand mode results in a different event scale, different likelihood formulas and LOPA no longer applies. Now let us look at cyber security and its likelihood scale. When we estimate risk in cyber physical systems we have to account for this, if we don’t a risk assessment might be a learning exercise because of the process it self but translating the results on a loss based risk scale would be fake.


Let us use the same line of thought used by process safety and translate this into the cyber security language. We can see a cyber attack as a Threat Actor applying a specific Threat Action to Exploit a Vulnerability, resulting in a Consequence. the consequence being a functional deviation of the target’s intended operation if we ignore cyber attacks breaching the confidentiality and focus on attacks attempting to impact the cyber physical system.

The threat actor + threat action + vulnerability combination has a certain event frequency, even if we don’t know yet what that frequency is, there is a certain probability of occurrence. That probability depends on many factors. Threat actors differ in capabilities and opportunity (access to target), also the exploit difficulties of a vulnerability differ and on top of all we protect these vulnerabilities using countermeasures (the protection layers in LOPA) we need to account for. We install antivirus to protect us against storing a malware infected file on the hard disk, we protect us against repeated logins that attempt brute force authentication by implementing a retry limit, we protect us against compromised login credentials by installing two factor authentication, etc. A vulnerability is not just a software deficiency, but also an unused open port on a network switch, or unprotected USB port on a server or desktop. There are hundreds of vulnerabilities in a system, each waiting to be exploited. There are also many cyber countermeasures, each with a certain effectiveness, each creating a protection layer. And with defense in depth we generally have multiple protection layers protecting our vulnerabilities. A very similar model as discussed for LOPA. This was recognized and a security method ROPA (Rings of Protection Analysis) was developed for physical security. Using the same principles to get a likelihood value based upon an event frequency.

Though ROPA was initially developed for physical security, this risk estimation method is and can also be used for cyber security. What is missing today is a standardized table for the IEF and the PFD of the various protection controls. This is not different from ROPA and LOPA because for both methods there is a guideline, but in daily practice each company defined its own list of IEF and PFDavg factors.

Another important difference with process safety is that cyber and physical security require like machinery a high demand / continuous mode which alters the risk estimation formulas (and event scales!), but the principles remain the same. So again the event frequency scale for cyber events differs from the event frequency scale used by LOPA. The demand rate for a firewall or antivirus engine is almost continuous, not limited to once a year like in the low demand mode of LOPA for process safety and derived from this business / mission risk.


The key message in above story is that the event scale used by process safety, for risk estimation is based upon failures of primarily physical equipment and accessories such as sealings and human errors. Where the event scale of cyber security is linked to the threat actor’s capabilities (Tactics, Techniques, Procedures), motivation, resources (Knowledge, money, access to equipment), opportunity (opportunities differ for an insider and outsider, some attacks are more “noisy” than others), it is linked to the effectiveness of the countermeasures (ease of bypassing, false negatives, maintenance), and the exposure of the vulnerabilities (directly exposed to the threat actor, requiring multiple steps to reach the target, detection mechanisms in place, response capabilities). These are different entities, resulting in different scales. We cannot ignore this when estimate loss based risk.

Accepting the conclusion that the event scales differ for process safety and for cyber security is accepting the impossibility to use the same risk assessment matrix for showing cyber security risk and process safety risk as is frequently requested by the asset owner. The impact will be the same, but the likelihood will be different and as such the risk appetite and tolerance criteria will differ.


So where are the flaws in IEC/ ISA 62443-3-2?

Starting with an inventory of the assets and channels in use is always a good idea. The next step, the High Level Risk Assessment (HLRA) is in my opinion the first flaw. There is no information available after the inventory to estimate likelihood. So it is suggested the method to set the likelihood to 1, basically risk assessment becomes a consequence / impact assessment at this point in time. An activity of the FMECA method. Why is a HLRA done, what is the objective of the standard? Well it is suggested that these results are later used to determine if risk is tolerable, if not a detailed risk assessment is done to identify improvements. It is also seen as a kind of early filter mechanism, focusing on the most critical impact. Additionally the HLRA should provide input for the zone and conduit analysis.

Can we using consequence severity / impact determine if the risk is tolerable (a limit suggested by ISA, the risk appetite limit is more appropriate than the risk tolerance limit in my view)?

The consequence severity is coming from the process hazard analysis (PHA) of the plant, so the HAZOP / LOPA documentation. I don’t think this information links to the likelihood of a cyber event happening. I give you a silly example to explain. Hazardous event 1, some one slaps me in the face. Hazardous event 2, a roof tile hits me on my head. Without the knowledge of likelihood (event frequency), I personally would consider the roof tile the more hazardous event. However if I would have some likelihood information telling me slapping me in the face would happen every hour and the roof tile once every 30 years I might reconsider and regret having removed hazard 1 from my analysis. FMECA is a far more valuable process than the suggested HLRA.

Does a HLRA contribute to the zone and conduit design? Zone boundaries are created as a grouping of assets with similar security characteristics following the IEC 62443 definition. Is process impact a security characteristic I can use to create this grouping? How can I relate a tube rupture in a furnace’s firebox to my security zone?

Well, then we must first ask ourselves how such a tube rupture can occur. Perhaps caused by a too high temperature, this I might link to a functional deviation caused by the control system or perhaps it might happen as the consequence that a SIF doesn’t act when it is supposed to act. So I may link the consequence to a process controller or maybe a safety controller causing a functional deviation resulting in the rupture. But this doesn’t bring me the zone, if I would further analyze how this functional deviation is caused I get into more and more detail, very far away from the HLRA. An APC application at the level 3 network segment could cause it, a modification through a breached BPCS engineering station at level 2 could cause it, an IAMS modifying the sensor configuration can cause it, and so on.

Security zone risk can be estimated in different ways, for example as zone risk following the ANSSI method. Kind of risk of the neighborhood you live in. We can also look at asset risk and set the zone risk equal to the asset with the highest risk. But all these methods are based on RPN, not on LBR.

HLRA’s just don’t provide valuable information, we typically use them for early filtering making a complex scope smaller. But that is neither required, nor appropriate for cyber physical systems. Doing a HLRA helps the risk consultant not knowing the plant or the automation systems in use, but in the process of estimating risk and designing a zone and conduit diagram it has no added value.

As next step ISA 62443-3-2 does a detailed risk assessment to identify the risk controls that reduce the risk to a tolerable level. This is another flaw because a design should be based upon an asset owner’s risk appetite, which is the boundary of the acceptable risk. The risk we are happy to accept without much action. The tolerable risk level is linked to the risk tolerance level, if we go above this we get unacceptable risk. An iterative detailed risk assessment identifying how to improve is of course correct, but we should compare with the risk appetite level not the risk tolerance level.

If the design is based on the risk tolerance level there is always panic when something goes wrong. Maybe our AV update mechanism fails, this would lead to an increase in risk, if we already are at the edge because of our security design we enter immediately in an unacceptable risk situation. Where normally our defense in depth, not relying on a single control, would give us some peace of mind to get things fixed. So the risk appetite level is the better target for risk based security design.

Finally there is this attempt to combine the process safety risk and the cyber security risk into one RAM. This is possible but requires a mapping of the cyber security risk likelihood scale on the process risk likelihood scale, because they differ. They differ not necessarily at a qualitative level, but the underlying quantitative mitigated event frequency scale differs. We can not say a Medium score on the cyber security likelihood scale is equivalent with a Medium score on the process safety likelihood scale. And it is the likelihood of the cyber attack that drives the cyber related loss based risk. We have to compare this with the process safety related loss based risk to determine the bigger risk.

This comparison requires a mapping technique to account for the underlying differences in event frequency. When we do this correctly we can spot the increase in business risk due to cyber security breaches. But only an increase, cyber security is not reducing the original process safety risk that determined the business risk before we estimated the cyber security risk.

So a long story, maybe a dull topic for someone not daily involved in risk estimation, but a topic that needs to be addressed. Risk needs a sound mathematical foundation if we want to base our decisions on the results. If we miss this foundation we create the same difference as there is between astronomy and astrology.

For me, at this point in time, until otherwise convinced by your responses, the IEC / ISA 62443-3-2 method is astrology. It can make people happy going through the process, but lacks any foundation to justify decisions based on this happiness.


There is no relationship between my opinions and references to publications in this blog and the views of my employer in whatever capacity. This blog is written based on my personal opinion and knowledge build up over 42 years of work in this industry. Approximately half of the time working in engineering these automation systems, and half of the time implementing their networks and securing them.


Author: Sinclair Koelemij

OTcybersecurity web site

The role of detection controls and a SOC

Abstract


This blog is about cyber security detection controls for cyber physical systems, process automation systems, process control systems or whatever we want to call them. The blog discusses their value in securing these systems and some of the requirements to consider when implementing them. As usual, my blogs approach the subject from a combination of the knowledge area of ​​cyber security and the knowledge area of ​​automation technology. More specific for this topic is the combination of Time Based Security and Asset Integrity Management.


It’s been a while since I started a blog, I postponed my retirement for another 2 years, so just too much to do to spend my weekends creating blogs. But sometimes the level of discomfort rises above my high alarm threshold for discomfort, forcing me to analyze the subject to better understand the cause of this discomfort. After seven months of no blogging, there are plenty of topics to discuss. For this blog I want to analyze the requirements for a cybersecurity detection function for cyber-physical systems. Do they differ from the requirements we set for information systems, and if so, what are these differences? Let’s start with the historical context.


Traditional cybersecurity concepts were based on a combination of fortress mentality and risk aversion. This resulted in the building of static defenses as described in the TCSEC and the Orange Book of the 1980s. But almost 40 years later, this no longer works in a world where the information resides increasingly at the very edge of the automation systems. Approximately 20 years ago a new security model was introduced as an answer to the increasing number of issues the traditional models were facing.

This new model was called Time Based Security, it is a dynamic view of cyber security based on protection, detection and response. Today we still use elements of this model, for example the NIST cybersecurity framework includes the TMS model by defining security as Identify, Protect, Detect, Respond and Recover. For the topic of the blog, I focus specifically on the three elements of the TMS model Protect, Detect and React. The idea behind this model is that the formula P> D + R defines a secure system. This formula expresses that the amount of time it takes for a threat actor to break through protection (P) must be greater than the time it takes to (D) detect the intrusion and the time it takes to respond ( R) on this intrusion.

Time Based Security model

In the days of the Orange Book we were building our fortresses, but also discovered that sooner or later someone found a path across, under or through the wall and we wouldn’t know about it. The TMS model kind of suggests that if we have a very fast detection and response mechanism, we can use a less strong protection mechanism. This is a very convenient idea in a world where systems become increasingly open.

This does not mean that we can throw away our protection strategies, it just means that in addition to protection, we can also implement a good detection and response strategy to compensate for a possible lack of protection. We need a balance, sometimes protection seems the logical answer, in other cases a focus on detection and response makes sense. If we compare this to physical security, it makes sense for a bank to protect a safe from the use of a torch burning through the safe’s wall. Delaying the attack increases the time we have to detect and respond. On the other hand, a counter that faces the public and is therefore relatively unprotected may benefit more from a panic button (detection) to initiate a response.

It is important to realize that detection and response are “sister processes” and that they are in series. If one fails, they both fail. Now with the concept of TMS in mind, let’s move on to a cyber attack on a physical cyber system.


To describe a cyber attack, I use the cyber kill chain defined by Lockheed Martin in combination with a so-called P-F curve. P-F curves are used in the Asset Integrity Management discipline to show equipment health over time to identify the interval between potential failure and functional failure. Since I need a relationship between time and the progress of a cyber attack, I borrowed this technique and created the following diagram.

P-F curve describing the cyber attack over time

A p-f curve has two axes, the vertical axis represents the cyber resilience of the cyber-physical system and the horizontal axis represents the progress of the attack over time. The curve shows several important moments in the time of the attack. The P0 point is where it all starts. In order for an attack to happen, we need a particular vulnerability, even more than this, the vulnerability must be exposed – the threat actor must be able to exploit it.

The threat actor who wants to attack the plant gathers information and looks for ways to penetrate the defenses. He / she can find multiple vulnerabilities, but eventually one will be selected and the threat actor will start developing an exploit. This can be malware that collects more information, but also when enough information has been collected, the code can be developed to attack the cyber-physical system (CPS).

To do this, we need a delivery method, sometimes along with a propagator module that penetrates deeper into the system to deliver the payload (the code that is doing the actual attack on the CPS) to one of the servers in the inner network segments of the system. This could be a USB stick containing malware, but it could also be a phishing email or a website infecting a user’s laptop and perhaps installing a keylogger that waits for the user to connect to the CPS from a remote location. It is not necessarily the factory it was initially aimed at, it could also be a supplier organization that builds the system or provides support services. Sensitive knowledge of the plant is stored in many places, different organizations build, maintain and operate the plant together and as such have a shared responsibility for the security of the plant. There are many scenarios here, for my example I propose that the attacker has developed malicious code with the ability to perform a scripted attack on the Basic Process Control System (BPCS). The BPCS is the automation function controlling the production process, if our target would be a chemical plant it will usually be a Distributed Control System (DCS).

The first time security is faced with the attack is on P1, where the chosen delivery method successfully penetrates the system to deliver its payload. Here we have protection mechanisms such as USB protection checks, antivirus protection, firewalls and maybe two-factor authentication against unauthorized logins. But we should also have detection controls, we can warn the moment a USB device is inserted, we can monitor who is logging into the system, we can even inspect what traffic is going through the firewall and see if it is using a suspicious amount of bandwidth , which indicates a download of a file. We can monitor many indicators to check if something suspicious is happening. All of this falls into a category defined as “early detection”, detection at a time when we can still stop the attack by an appropriate response before the attack hits the BPCS.

Nevertheless, our threat actor is skilled enough to slip through this first layer of defense and the malicious code delivers the payload to a server or desktop station of the BPCS. At this point (P2), the malicious code is installed in the BPCS and the threat actor is ready for its final attack (P3). We assume that the threat actor uses a script that describes the steps to attack the BPCS. Perhaps the script is writing digital outputs that shut down a compressor or initiate an override command to bypass a specific safety instrument function (SIF) in the safety system. Many scenarios are possible at this level in the system once the threat actor has gathered information about how the automation features are implemented. Which tag names represent which function, which parameters to change, which authorizations are required, which parameters are displayed, etc.

At this point, the threat actor passed several access controls that protect the inner security zones, passed controls that prevented malicious code from installing on the BPCS servers / desktops, and whitelisted the application controls that prevented execution of code. For detection at this level, we can use different audit events that signal access to BPCS system, we can also use anomaly detection controls that signal abnormal traffic. An important point here is that the attacker has already penetrated very deep into the system, at such a level that the reaction time to stop the attack is almost impossible without an automated response.

The problem with what we call “late detection” is that we need an automated response to be on time when the actor has an immediate malicious intent. Only when the threat actor postpones the attack until a later moment can we find the time to respond “manually”. However, an automated response requires a lot of knowledge of what to do in different situations and requires a high level of confidence in the detection system. A detection system that delivers an abundance of false positives would become a bigger threat to the production system than a threat actor.


If we look at how quickly attacks on cyber-physical systems progress, we can take Ukraine’s attack on the electricity grid as an example. The estimated time per attack here was estimated to be less than 25 minutes. In these 25 minutes – the speed of onset – the threat actors gained access to the SCADA system: opened the circuit breakers; corrupted the firmware of a protocol converter preventing the panel operators from closing the circuit breakers remotely; and wiped the SCADA hard drives. So in our theoretical TMS model, we would need a D + R time of less than 25 minutes to be effective, even if only partially effective, depending on the moment of detection. This is very short.

Can a security operations center fill this role? What would this require? Let us first look at the detection function to find an answer.


First of all we need a reliable detection mechanism, a detection mechanism that causes false positives will soon slow down any reaction. What is required for a reliable detection mechanism:

  • In-depth knowledge of the various events that can happen, what is an expected event and what is a suspicious event? This can differ depending on the plant’s modes such as: normal operation, abnormal operation, or emergency. Also system behavior is quite different during a plant stop. All of these conditions can be a source of suspicious events;
  • In-depth knowledge of the various protocols in use, for system’s such as DCS including a wide set of proprietary protocols not publicly documented. Also these have shown to be a considerable hurdle for anomaly detection systems;
  • In-depth knowledge of process operations, what activities are normal and which not? Should we detect the modification of the travel rate of a valve, is the change of this alarm setting correct, is disabling this process alarm a suspicious event or a normal action to address a transmitter failure? This level of detection is not even attempted today, anomaly detection systems might detect the program download of a controller or PLC, but the process operator would also know this immediately without a warning from the SOC. In all cases close collaboration with process operations is essential, this would slow down the reaction.

How if the security operations center (SOC) is outsourced, what would be different from an “in-company” SOC?

  • On the in depth knowledge of the various events that can happen, the outsourced SOC will have a small disadvantage because as an external organization the SOC will not always be aware of the the different plant states. But overall it will perform similarly as an in-company SOC.
  • On the in-depth knowledge of the various protocols, the outsourced SOC can have a disadvantage because it will have a bigger learning curve with multiple similar customers. Never the less knowledge of the proprietary protocols would remain a hurdle.
  • The in-depth knowledge of process operations is in my opinion fully out of reach for an outsourced SOC. As such control over this would remain primarily a protection task. Production processes are too specific to formulate criteria for normal and suspicious activity.

How about if the threat actor would also target the detection function? Disabling the detection function during the attack will certainly prevent the reaction. In the case of an outsourced SOC we would expect:

  • A dedicated connection between SOC and plant. If the connection would be over public connections such as the Internet a denial of service attack would become feasible to disable the detection function;
  • A local – in the plant – detection system would still provide information on what is going on if the connection to the SOC fails. The expertise of a SOC might be missing but the detection function would still be available;
  • The detection system would be preferably “out of band” because this would make a simultaneously attack on protection and detection systems more difficult.

How about the reaction function what do we need to have a reaction that can ‘outperform” the threat actor?

Reaction is a cyber physical system is not easy because we have two parts, the programmable electronic automation functions that are attacked and the physical system controlled by the automation system. The physical system has completely independent ‘dynamics”, we can’t just stop an automation function and expect the physical process to be stable in all cases. Cooling might be required, or Even during a plant stop we often need certain functions to be active. Even after a black shutdown – ESD 0 / ESD 0.1 – some functions are still required. There are rotating reactors that need to keep rotating to prevent a runaway reaction, a cement kiln needs to rotate otherwise it just breaks under its wait, cooling might be required to prevent a thermal runaway, and we need power for many functions.

Stopping a cyber attack by disconnecting from external networks is also not always a good idea. Some malware “detonates” when it looses its connection with a command and control server and might wipe the hard disk to hide its details. Detection therefore requires a good identification on what is happening and the reaction on this needs to be aligned with the attack but also with the production process. A wrong reaction can easily increase the damage.

While a SOC can often actively contribute to the response to a breach of the security of an information system, this is in my opinion not possible for a cyber-physical system. In a cyber-physical system, the state of the production process is essential, but also which automation functions remain active. In principle, a safety system – if present – can isolate process parts, make the installation pressure-less / de-energized, but even then some functions are required. Process operations therefore play a key role in the decision-making process, it is generally not acceptable to initiate an ESD 0 when a cyber attack occurs. So several preparatory actions are needed to organize a reaction, such as:

  • We need a disconnection process describing under what circumstances disconnection is allowed and what alternative processes need to startup when disconnection is activated. Without having this defined and approved before the situation occurs it is difficult to quickly respond;
  • We need to have playbooks that document what to do in what situation depending on which automation function is affected. Different scenarios exist we need to be ready and not improvise at the moment the attack occurs, some guidance is required;
  • We need to understand how to contain the attack, is it possible to split a redundant automation system in two halves, a not affected part and an affected part;
  • We need to understand if we can contain the attack to parts of the plant if multiple “trains” exist in order to limit the overall impact;
  • We need to test / train processes to make sure they work when needed.

All this would be documented in the incident handling process where containment and recovery zones, and response strategies are defined to organize an adequate and rapid response. But all this must be in accordance with the state of the production process, possible process reconstitution and the defined / selected recovery strategy.

Process operations plays a key role in the decision making during a cyber attack that impacts the physical system. As such a SOC is primarily advisor and spectator because a knowledge gap. Site knowledge is key here, detailed knowledge of the systems and their automation functions is essential for the reaction process.

Of course we should also think about recovery, but the first focus must be on detection and response, because here we can still limit the impact of the cyber attack if our response is timely and adequate. If we fail at this stage, the problems could be bigger than necessary. An OT SOC differs very much from an IT SOC and has a limited role because of the very specific requirements and unique differences per production process.

So in the early detection zone, a SOC can have a lot of value. In the late detection zone, in the case where the threat actor would act immediately, I think the SOC has a limited role and the site team should take up the incident handling process. But in all cases, with or without a SOC, detection and reaction is a key part of cyber security. It is important to realize that detection and reaction are “sister processes”, even the best detection system is rather useless if there is no proper reaction process that supports it.


There is no relationship between my opinions and references to publications in this blog and the views of my employer in whatever capacity. This blog is written based on my personal opinion and knowledge build up over 42 years of work in this industry. Approximately half of the time working in engineering these automation systems, and half of the time implementing their networks and securing them.


Author: Sinclair Koelemij

OTcybersecurity web site

Identifying risk in cyber physical systems

Abstract


This blog is about risk, more precise about a methodology to estimate risk in cyber physical systems. Additionally I discuss some of the hurdles to overcome when estimating risk. It is a method used in both small (< 2000 I/O) and large projects (> 100.000 I/O) with proven success in showing the relationship between different security design options, the cyber security hazards, and the change in residual cyber security risk.


I always thought the knowledge of risk and gambling would go hand in hand, but risk is a surprisingly “recent” discovery. While people gamble thousands of years, Blaise Pascal and Pierre de Fermat developed the risk methodology as recently as 1654. Risk is unique in the sense that it allowed mankind for the first time to make decisions based on forecasting the future using mathematics. Before the risk concept was developed, fate alone decided over the outcome. Through the concept of risk we can occasionally challenge fate.

Since the days of Pascal and De Fermat many other famous mathematicians contributed to the development of the theory around risk. But the basic principles have not changed. Risk estimation, as we use it today, was developed by Frank Knight (1921) a US economist.

Frank Knight defined some basic principles on what he called “risk identification”, I will quote these principles here and discuss them in the context of cyber security risk for cyber physical systems. All mathematical methods today estimating risk still follow these principles. There are some simple alternatives that estimate likelihood (this is generally the difficulty) of an event using some variables that influence likelihood (e.g. using parameters such as availability of information, connectivity, and management) but they never worked very accurate. I start with the simplest of all, principle 1 of the method.

PRINCIPLE 1 – Identify the trigger event

Something initiates the need for identifying risk. This can be to determine the risk of a flood, the risk of a disease, and in our case the risk of an adverse affect on a production process caused by a cyber attack. So the cyber attack on the process control and automation system is what we call the trigger event.

PRINCIPLE 2 – Identify the hazard or opportunity for uncertain gain.

This is a principal formulated in a way typical for an economist. In the world of process control and automation we focus on the hazards of a cyber attack. In OT security a hazard is generally defined as a potential source of harm to a valued asset. A source of discussion is if we define the hazard at automation system level or at process level. Ultimately we of course need the link to the production process to identify the loss event. But for an OT cyber security protection task, mitigating a malware cascading hazard is a more defined task than mitigating a too high reactor temperature hazard would be.

So for me the hazards are the potential changes in the functionality of the process control and automation functions that control the physical process. Or the absence of such a function preventing manual or automated intervention when the physical process develops process deviations. Something I call Loss of Required Performance (performance deviates from design or operations intent) or Loss of Ability to Perform (function is lost, cannot be executed or completed), using the terminology used by the asset integrity discipline.

PRINCIPLE 3 – Identify the specific harm or harms that could result from the hazard or opportunity for uncertain gain.

This is about consequence. Determining the specific harm in a risk situation must always precede an assessment of the likelihood of that harm. If we would start with analyzing the likelihood / probability, we would quickly be asking ourselves questions like “the likelihood of what?” Once the consequence is identified it is easier to identify the probability. In principal a risk analyst needs to identify a specific harm / consequence that can result from a hazard. Likewise the analyst must identify the severity or impact of the consequence. Here starts the first complexity when dealing with OT security risk. In the previous step (PRINCIPLE 2) I already discussed the reason for expressing the hazard initially at control and automation system level to have a meaningful definition I can use to define mitigation controls (Assuming that risk mitigation is the purpose of all this). So for the consequence I do the same I split the consequence of a specific attack on the control and automation system from the consequence for the physical production. When we do this we no longer have what we call a loss event. The consequence for the physical system results in a loss, like no product, or a product with bad quality, or worse perhaps equipment damage or fire and explosion, possibly injured people or casualties, etc.

The answer for this is, what is called a risk priority number. A risk priority number is based upon what we call consequence severity (just a value on a scale). Where “true” risk would be based on an impact expressed in terms of loss. A risk priority number can be used for ranking identified hazards, they cannot be used for justifying investments. For justifying investments we need to have a risk value based upon a loss. But this step can be achieved later. Initially I am interested in selecting the security controls that contribute most to reducing the risk for the control and automation system. Convincing business management to invest in these controls is a next step. To explain this, I use the following picture.

Risk process

In the middle of the picture there is the functional impact, the deviation in the functionality of the control and automation system. This functional deviation results in a change (or absence off) the control and automation action. This change will be the cause of a deviation in the physical process. I discuss this part later.

PRINCIPLE 4 – Specify the sequence of events that is necessary for the hazard or opportunity for uncertain gain to result in the identified harm(s).

Before we can estimate the uncertainty, the likelihood / probability, we need to identify the specific sequence of events that is necessary for the hazard to result in the identified consequence. The likelihood of that precise sequence occurring will define the probability of the risk. I can use the word risk here because this likelihood is also the likelihood we need to use for the process risk, because it is the cyber-attack that causes the process deviation and the resulting consequence. (See above diagram)

The problem we face that there are many paths leading to from the hazard to the consequence. We need to identify each relevant pathway. On top of this as cyber security specialists we need to add various hurdles for the threat actors to block them reaching the end of the path, the consequence of the attack. This is where counterfactual risk analysis offers the solution. This new methodology helps us achieve this. The method analysis each possible path, based upon a repository filled with hundreds of potential event paths, and estimates the resulting likelihood of each path. Which is the next topic, PRINCIPLE 5.

PRINCIPLE 5 – Identify the most significant uncertainties in the preceding steps.

We can read the time when this statement was written in the sentence “identifying the most significant uncertainties”. In times before counterfactual analysis we needed to limit the number of paths to analyze. This can lead to and actually did lead to incidents because of missing an event path that was considered insignificant or just not identified (e.g. the Fukushima Daiichi nuclear incident). The more complex the problem, the more event paths exist, the easier we forget one. Today the estimation of likelihood and so risk progressed and is dealt with differently. Considering the complexity of the control and automation systems we have today combined with the abundance of tactics, technologies, and procedures available for the threat actor to attack, the number of paths to analyze is very high. Traditional methods can only cover a limited amount of variations, generally obvious attack scenarios we are familiar with before we start the risk analysis. The result of the traditional methods do not offer the level of detail required. Such a method would spot the hazard of malware cascading risk, the risk that malware propagates through the network. But it is not so important to learn how high malware cascading risk is, it is more important to know if it exists, which assets and channels cause it, and which security zones are affected. This information results from the event paths used in described method.

These questions require a risk estimation with a level of detail missed by the legacy methods. This is specifically very important for OT cyber security, because the number of event paths leading to deviation of a specific control and automation function is much larger than for example the number of event paths identified in process safety hazard analysis. An average sized refinery quickly leads to over 10.000 event paths to analyze.


Still we need “true” risk, risk linked to an actual loss. So far we have determined the likelihood for the event paths, we have grouped these paths to link them to hazards, so we have a likelihood for a hazard and we have a likelihood that a specific consequence can happen. Happily we can consolidate the information at this point, because we need to assign severity. Consequences (functional deviations) can be consolidated in what are called failure modes.

These failure modes result in the deviations in the production process. The plant has conducted a process safety hazop (process hazard analysis for US readers) to identify the event paths for the production system. The hazop identifies for a specific physical deviation (e.g. too high temperature, too high pressure, reverse flow, etc.) what the cause could be of this deviation and what the consequence for the production system is. These process event paths have a relationship with the failure modes / consequences identified by the first part of the risk analysis. A specific cause is can only result from a specific failure mode. We can link the cause to the failure mode and get what is called the extended event path (See diagram above) This provides us with part of the production process consequences. These consequences have an impact, an actual loss to get the mission risk required for justification of cyber security investment.

But the hazop information does not provide all possible event paths because there might be a new malicious combination of causes missed (causes can be combined by an attacker in a single attack to create a bigger impact) and we can attack the safeguards. For example we have the safety instrumented system that implements part of the countermeasures that can become a new source of risk.

The role of the SIS

To explain the role of a SIS, I use above picture to show that OT cyber security has a limited scope within overall process safety (And it would be even more limited if I used the word safety that defines personal safety, process safety, and functional safety). Several of the safeguards specified for the process safety hazard might not be a programmable electronic system and as such not a target for a cyber attack. But some such as the safety instrumented system, or a boiler management system are, so we need to consider them in our analysis and add new extended event paths where required. TRISIS / TRITON showed us SIS is a source of risk.


Since the TRISIS / TRITON cyber attack we need to consider SIS also as a source of new causes most likely not considered in a hazop. The TRISIS/TRITON attack showed us the possibility of modifying the program logic of the logic solver. This can range from simple actions like not closing shutdown valves prior to opening blow down valves and initiating a shutdown action to more complex unit or equipment specific scenarios. Though at operations level we distinguish between manual and automated emergency shutdown, for cyber security we cannot make this difference. Automated shutdown meaning the the shutdown action is triggered by a measured trip level and manual shutdown meaning that the shutdown is triggered by a push button, within the SIS program it is all the same. Once a threat actor is capable of modifying the logic, the difference between manual and automated shutdown disappears and even the highest level of ESD (ESD 0) can be initiated, shutting down the complete plant, potentially with tampered logic.

Consequences caused by cyber attacks so far

If we would look at what would be the ultimate loss resulting from a cyber attack, The “only” loss not caused by a cyber attack are so far fire, explosion, and loss of life. This is not because a cyber attack has not the capability to cause these losses, but we were primarily lucky that some attacks failed. Let’s hope we can keep it that way by adequately analyzing risk and mitigating the residual risk to a level that is acceptable / tolerable.


I don’t want to make the blog too long, but in future blogs I might jump back to some of these principles. There is more to explain on the number of risk levels, how to make risk actionable, etc. If you would unravel the text and add some more detail that I didn’t discuss the used risk method is relatively simple as the next diagram shows.

NORSOK risk model

This model is used by the Norwegian offshore industry for emergency preparedness analysis. A less complex analysis as a cyber security analysis is but that difference is primarily in how the risk picture is established. This picture is from the 2010 version (rev 3) but not that different from the rev 2 version (2001) that is freely available on the Internet. This model is also very similar to ISO 31000 shown in the next diagram.

ISO 31000 risk model

If you read how and where these models are used and how field proven the models are, also in the control and automation world, might explain a bit how surprised I was when I noticed IEC/ISA 62443-3-2 invented a whole new approach with various gaps. New is good when existing methods fail, but if methods exist that meet all requirements for a field proven methodology I think we should use these methods. Plants and engineers don’t benefit from reinventing the wheel. I am adding IEC to the ISA 62443 because last week IEC approved the standard.

I didn’t make this blog to continue the discussion I started in my previous blog, though actually there was no discussion no counter arguments were exchanged – neither did I change my opinion, but to show how risk can / was / is used in projects is important. Specifically because the group of experts doing formal risk assessments is extremely small. Most assessments end up in a short list of potential cyber security risk without identifying the sources of this risk in an accurate manner. In those situations it is difficult understand which countermeasures and safeguards are most effective to mitigate the risk. It also would not provide the level of detail necessary for creating a risk register for managing cyber security based on risk.


There is no relationship between my opinions and references to publications in this blog and the views of my employer in whatever capacity. This blog is written based on my personal opinion and knowledge build up over 42 years of work in this industry. Approximately half of the time working in engineering these automation systems, and half of the time implementing their networks and securing them.


Author: Sinclair Koelemij

OTcybersecurity web site

ISA 62443-3-2 an unfettered opinion

Abstract

This blog is about the in April published new ISA 99 standard, where risk and securing process control and automation systems meet. My blog is an evaluation of part ISA 62443 3-2: Security risk assessment for system design – April 2020).

I write the blog because I struggle with several of the methods applied by the standard and apparent lack of input from the field. The standard seems to ignore practices successfully used in major projects today and replaces these by in my opinion incomplete and inferior alternatives. Practices that for example are used for process safety risk analysis.

Since I executed in recent years several very large risk assessments for greenfield refineries, chemical plants and national critical industry, my technical heart just can’t ignore this. So I wanted to address these issues, because I believe the end result of this standard does not meet the quality level appropriate for an ISA 62443 standard. Very hard conclusion I know, but I will explain in the blog why this is my opinion.

When criticizing the work of others, I don’t want to do this without offering alternatives, so also in this case where I think the standard should be improved I will give alternatives. Alternatives that worked fine in the field and where applied by asset owners with a great reputation in cyber security of their plants. If I am wrong, hopefully people can show me where I am wrong and convince me the ISA 62443 3-2 can be applied.

I have been struggling with the text of this blog for 3 weeks now, I found my response too negative and not appreciating all the work done by people in the task group primarily in their spare time. So let me, before continuing with my evaluation, express my appreciation for making the standard. It is important to have a standard on this subject and it is a lot of work to make it. Having a standard document is always a good step forward, even if just for target practicing. Never the less I also have to judge the content, therefore my evaluation.

It is a lengthy blog this time, even longer than usual. But not yet a book, for a book it lacks the details on how, it has a rather quick stop and not a happy end. Perhaps one day when I am retired and free of projects I will create such a book, this time just a lengthy blog to read. People that conduct or are interested in risk assessments for OT cyber security should read it, for all others it might be too much to digest. Just a warning.


Because I can imagine that not everyone reads or has read the ISA 62443-3-2, I provide a high level overview of the various steps. I can’t copy the text 1 on 1 from the standard, that would violate ISA’s copy right. So I have to do it using my own words, which are in general a little less formal than the standard’s text. Since making standards requires a lot of word smithing, I hope I don’t deviate too much from the intentions of the original text. For the discussion I focus on those areas in the standard that surprised me most.

The standard uses 7 steps between the start of a risk assessment project to the end.

  • First step is to identify what the standard calls the “system under consideration”. So basically making an inventory of the systems and its components that require protection;
  • Second step in the proposed process is an initial cyber security risk assessment. This step I will evaluate in more detail because I believe the approach here is wrong and I question if it really is a risk assessment;
  • Third step is to partition the system into zones and conduits. High level I agree with this part, though I do have some minor remarks;
  • Fourth step asks the question if the initial risk found in the second step exceeds tolerable risk? Because of my issues with step 2, I also have issues with the content of this step;
  • Fifth, if the risk exceeds tolerable risk a detailed risk assessment is required. I have a number of questions here, not so much the principle itself but the detail;
  • In the sixth step the results are documented in the form of security requirements, plus adding some assumptions and constraints. Such a result I would call a security design / security plan. The standard doesn’t provide much detail here, so only a few comments from my side;
  • And finally in the seventh step there is an asset owner approval. Too logical for debate.

High level these 7 steps represent a logical approach, it are the details within these steps that inspire my blog.

Let me first focus on some theoretical points considering risk, starting with the fundamental tasks that we need to do before being able to estimate risk and than check the standard how it approaches these tasks.


In order to perform a cyber security risk analysis, it is necessary to accomplish the following fundamental tasks:

  • Identify the assets in need of protection;
  • Identify the kind of risks (or threats) that may affect the assets;
  • Determine the risk criteria for both the risk levels as well as the actions to perform when a risk level is reached;
  • Determine the probability of the identified risk occurring;
  • And determine the impact or effect on the plant if a given loss occurs.

Let’s evaluate the first steps of the standard against these fundamental principles.


Which assets are in need of protection for an ICS/IACS?

The ISA 62443-3-2 standard document doesn’t define the term asset, so I have to read the IEC 62443-1-1 to understand what according to IEC/ISA 62443 an asset is. According to the IEC 62443-1-1 standard the asset is defined as – in less formal words as used by the standard – an asset is a “physical or logical object” owned by a plant. The standard is here less flexible than my words because an asset is not necessarily owned by a plant, but to keep things simple I take the most common case where the plant owns the assets. The core of the definition is, an asset is a physical or a logical object. So translated into technical language, an asset is either equipment or a software function.

IEC 62443-1-1 specifies an additional requirement for an asset, it needs to have either a perceived or actual value. Both equipment and a software function have an actual value. But there is in my opinion a third asset with a perceived value that needs protection. This is the channel, the communication protocol / data flow used to exchange data between the software functions. Not exactly a tangible object but still I think I can call at minimum an asset if I consider it a data flow using a specific protocol.

Protection of a channel is important, cyber security risk is for a large part linked to exposure of a vulnerability. Vulnerable channels, for example a data flow using the Modbus TCP / IP protocol (this protocol has several vulnerabilities that can be exploited), induce risk. So for me the system under consideration is:

  • The physical equipment (e.g. computer equipment, network equipment, and embedded devices);
  • The functions (software, for example SIS (Safety Instrumented System) and BPCS (Basic process Control System). But many more in today’s systems);
  • And the channels (the data flows, e.g. Modbus TCP/IP or a vendor proprietary protocol).

The ISA 62443-3-2 standard document doesn’t mention these three as explicitly as I do, but the text is also not in conflict with my definition of assets in need of protection. So no discussion here from my side. Before we can assess OT cyber security risk we need to have a good overview of these “assets”, the scope of the risk assessment.


The second step is an initial risk assessment, here I start to have issues. The standard asks us to identify the “worst case unmitigated cyber security risk” that could result from a cyber attack. It suggests to express this in terms of impact to health, safety, production loss, product quality, etc. This is what I call mission risk or business risk. The four primary factors that induce this risk are:

  • Process operations;
  • Process safety;
  • Asset integrity;
  • Cyber security;

Without process safety many accidents can occur, but even a plant in a perfect “safe” state can impact product quality and production loss. So we need to include process operations as well. Failing assets can also lead to production loss, or even impact to health. Asset integrity is the discipline that evaluates the maintenance schedules and required maintenance activities. Potential failures made by this discipline also add to the business / mission risk. And then we have cyber security. Cyber security can alter or halt the functionality of the various automation functions, and can alter data integrity, and even compromise the confidentiality of a plant’s intellectual property. All above are elements that can result in a loss and so induce mission risk. But cyber security can do more than this, it can make implemented safety integrity functions (SIF) for process safety ineffective, it can misuse the SIF logic to cause loss. Additionally cyber security can also cause excessive wear of process equipment not accounted for by asset integrity. Cyber security is an element that influences all.

For determining initial risk, the approach taken by the standard is to use the process hazard analysis (PHA) results as input for identifying the worst case impacts. And additional to this the standard requests us to consider information from the sector, governments, and other sources to get information on the threats.

I have several issues here. The first, can we have risk without likelihood? The PHA can define a likelihood in the PHA sheet, but this likelihood has no relationship with the likelihood of facing a cyber attack. So using it would would not result in cyber security risk.

Another point is that if we consider the impact, the PHA would offer us the worst case impact based upon the various deviations analyzed from a process safety perspective. But this is not necessarily the worse case impact from a business perspective.

See the definition for process safety: “The objective of process safety management is to ensure that potential hazards are identified and mitigation measures are in place to prevent unwanted release of energy or hazardous chemicals into locations that could expose employees and others to serious harm.”

The PHA would not necessarily analyze the impact of product quality for the company. Pharmaceutical business and food and beverage business can face major impact if its products would have a quality issue, while their production process can be relatively safe compared to a chemical plant.

If we would take the PHA as input, will it address the “worst case impact”? PHA will certainly be complete for the analysis of the process deviations (the structured approach of the PHA process enforces this) and complete for the influence of these deviations on process safety, so should also be complete for the consequences too if all process deviations are examined.

But the PHA might not be complete when it comes to the possible causes, because PHA generally doesn’t consider malicious intent. So there might be additional causes that are not considered as possible by the PHA.

Causes are very important because these result from functional deviations as result of the cyber attack. It is the link between the functional deviation and its physical effect on the production process that causes the process deviations and its consequence / impact.

If it is not guaranteed that the PHA covers all potential causes, the reverse path from “worst case impact” in the PHA to the “cyber security functional deviation” that causes a process deviation is interrupted. This interruption doesn’t only prevent us from getting a likelihood value, but also prevents us from identifying all mitigation options. Walking the event path in the reverse direction is not going to bring us the likelihood of the process deviation happening as result of a cyber attack, so we don’t have risk.

If I follow the methodology of analyzing risk using event paths, I have the following event path:

A threat actor executes a threat action to exploit a vulnerability resulting in some desired consequence, this consequence is a functional deviation causing a process deviation with some process consequence.

The process consequence has a specific impact for the business / mission, such as production loss, potential casualties, a legal violation, etc. This impact (expressed as loss) creates business risk.

The picture shows that the risk path between a cyber security breach resulting in mission impact requires several steps. The standard jumps right to the end (business impact) not considering intermediate consequences, by doing this the standard ignores options to reduce risk. But more on this later.

The path toward mission risk

So as an example of an event path: A nation sponsored organization (threat actor) gains unauthorized access into an ICS (threat action) by capturing the access credentials of an employee without two factor authentication (vulnerability), modifying the range of a tank level instrument (functional deviation), causing a too high level in the tank (process deviation) with as potential consequence overfilling the tank (process consequence) resulting in a loss of containment of a potentially flammable fluid causing toxic vapors requiring an evacuation resulting in potentially multiple casualties and an approximate $500.000 production and cleaning cost loss (business impact).

An extended event path in more detail

The likelihood that this event path, scenario, happens as result of a cyber attack is determined by the likelihood of the cyber security failure. The PHA might have considered a similar process deviation (High level in the tank) during the analysis, perhaps with as cause mentioned a failed level transmitter, and reached the same process consequence as potential loss of containment. All very simplified, don’t worry we do apply additional controls.

But the likelihood assigned to this process safety hazard would have been derived from a LOPA (Layers Of Protection Analysis) assignment based on an initiating frequency assignment and an IPL (Independent Protection Layer) reduction factor and MTBF factors of the instrument to estimate a SIL required for the safeguard. There is no relationship between the likelihood of the process deviation in the PHA and the cyber security likelihood.

Important is to realize that not all risk estimates are necessarily linked to a loss. Ideally this is so, because the loss justifies the investment in mitigation. But in many cases we can use what are called risk priority numbers, a risk score based on likelihood and severity for ranking purposes. A risk priority number is often enough for us to decide on mitigation and prioritizing mitigation. For design we only need business risk if the investment needs to be justified. The risk priority numbers already show the most important risk from a technical perspective.

However my conclusion is that the standard is not approaching the initial risk assessment by estimating cyber security risk, it seems to focus on two other aspects:

  • What is the worst impact (Expressed as a loss);
  • and what does the threat landscape look like.

Neither of them providing a risk value. I fully understand the limitation, because so early in a project there is not enough information available to estimate risk at a level of detail showed above.

So in my opinion an alternative approach is required, and such alternatives exist. Better they have been widely applied in the industry in recent years, but for some reason are ignored by the task group and replaced by something questionable in my opinion.

So how did projects resolve the lack of information and still get important information for understanding the business impact and threats to protect against? Following activities were performed in projects:

  • Create a threat profile by conducting a threat assessment;
  • Conduct a criticality assessment / business impact analysis.

What is a threat profile? The objective of a threat profile is to:

  • Identify the threat actors to be considered;
  • Identify and prioritize cyber security risk;
  • Align information security risk and OT security risk strategies within the company.

Identifying and prioritizing cyber security risk is done by studying the threat landscape based upon various reliable sources, such as information from a local CERT, MITRE, FIRST, ISF, and various commercial sources. These organizations show the developments in the threat landscape explaining the activities of threat actors and what they do.

Threat actors are identified and their relevance for the company can be rated based on criteria such as: intent, origin, history, motivation, capability, focus. Based on these criteria a threat strength and likelihood can be estimated. Various methods have been developed, for example the method developed by ISF is frequently used.

Based on the information on threat actors and their methods and their focus, a threat heat map is created. So the asset owner can decide on what the priorities are. This is an essential input for anyone responsible for the cyber security of a plant, but also important information for a cyber security risk assessment. Threat actors considered as relevant, play a major role in the required risk reduction for an appropriate protection level. If we don’t consider the threat actor we will quickly over-spend or under-spend on risk mitigation.

In the ISA 62443-3-2 context, the target security level (SL-T) is used as the link toward the threat actor. Because ISA security levels link to motivation, capability, and resources of the threat actor, a security level also identifies a threat actor. The idea is to identify a target security level for each security zone and use this to define the technical controls for the assets in the zone, specified as capability security levels (SL-C) in the IEC 62443-3-3. The IEC 62443-3-3 provides the security requirements that the security zones and conduits must meet to offer the required level of protection.

The ISA 62443-3-2 document does not explain how this SL-T is defined. But if the path is to have an SL-T per security zone, then we need to estimate zone risk. Zone risk is something very different from asset risk or threat based risk. The ANSSI standard provides a method to determine zone risk and uses the result to determine a security class (A,B, C) something similar as the ISA security levels.

I would expect a standard document on security risk assessment to explain the zone risk process, but the standard doesn’t. Because the methodology actually seems to continue with an asset based risk approach I assume the idea is that the asset with the highest risk level in a zone determines the overall zone risk level. This is a valid approach but more time consuming than the ANSSI approach.

For a standard / compliance based security strategy a zone risk approach would have been sufficient. The use of SL-T and SL-C and reference to IEC 62443-3-3 seems to suggest a standard’s / compliance based security approach.


How about the other method in use, the criticality assessment. What does it offer? The criticality assessment helps to establish the importance of each functional unit and business process as it relates to the production process. Illustrating which functions need to be recovered, how fast do they need to be recovered and what their overall importance is from both a business perspective as well as from a cyber security perspective. Which are two totally different perspectives. An instrument asset management system might have a low importance from a business point of view, but because of its connectivity to all field instrumentation it can be considered an important system to protect from a cyber security perspective.

So executing a criticality assessment as second step provides the criticality of the functions (importance and impact do correlate), and it provides us with information on the recovery timing.

OT cyber security risk should not exclusively focus on the identification of the risk related to the threats and how to mitigate it. Residual business risk is not only influenced by preventative and detective controls but also by the recovery potential and speed, because the speed of recovery determines business continuity and lack of business continuity can be translated to loss.

ISA 62443-3-2 doesn’t address the recovery aspect in any way. As the risk assessment is used to define the security requirements, we can not ignore recovery requirements. NIST CSF does acknowledge recovery as an important security aspect, I don’t understand why the ISA 62443-3-2 task group ignored recovery requirements as part of their design risk assessment.

It is important to know the recovery point objective (RPO), recovery time objective (RTO) and maximum tolerable downtime (MTD) for the ICS / IACS. Designing recovery for a potential cyber threat, for example a ransomware infection, differs quite a lot from data recovery from an equipment failure.

In a plant with its upstream and down stream dependencies and storage limitations, these parameters are important information for a security design. See below diagram for the steps in a typical cyber incident. Depending on their detailed procedures, these steps can be time consuming.

Response and recovery

The criticality assessment investigates Loss of Ability to Perform over a time span, for example how do we judge criticality after 4 hours, 8 hours, a day, a week, etc… This allows us to consider the dependencies of upstream and downstream processes, and storage capacity. But apart from looking at loss of ability to perform, loss of required performance and loss on confidentiality are also evaluated in a cyber security related criticality assessment. Specifically the loss of required performance links to the “worst impact” looked for by the ISA 62443-3-2.

We also need to consider recovery point objectives (RPO) and understand how the plant wants to recover, are we going to use the most recent controller checkpoint or are there requirements for a controller checkpoint that brings the control loops into an known start-up state.

We need to understand the requirements for the recovery time objective (RTO), this differs for cyber security compared to a “regular” failure. For cyber security we need to include the time taken by the incident response tasks, such as containment and eradication of the potential malware or intruder.

It makes a big difference in time if our recovery strategy opts for restoring a back-up to new hard drives, or if we decide to format the hard drives before we restore (and what type of reformatting would be required). Other choices to consider are back-up restore over the network from one or more central locations, or restore directly at computer level using USB drives. All of this and more has time and cost impact that the security design needs to take into account.

The role of the criticality assessment is much bigger than discussed here, but it is an essential exercise for the security design and as such for the risk assessment that also requires us to assess consequence severity. Consequence severity analysis is actually just an extension of the criticality analysis.

Another important aspect of criticality analysis is that it includes ICS / IACS functions not being related to any of the hazards identified by the PHA. For our security design we need to include all IACS systems, not limit our selves to systems at Purdue reference model level 0, 1 and 2.

A modern IACS has many functions, all ignored by the ISA 62443-3-2 standard if we start at the PHA. IACS includes not only the systems at the Purdue level 0, 1 and 2, (systems typically responsible for the PHA related hazards) but also the systems at level 3. Systems that can still be of vital importance for the plant. The methodology of the standard seems to ignore these.

Another role for the criticality assessment is directly related to the risk assessment. An important question in a large environment is do we assess risk per sub-system or for the whole system. Doing it for the whole system (IACS) with all its sub-systems (BPCS, SIS, MMS, …) and a large variation of different consequences and cross relations, or do we assess risk per function and consolidate these results for comparison in for example a risk assessment matrix.

The standard seems to go for the first approach, which in my opinion (based upon risk assessments for large installations) is a far too difficult and complex exercise. If we keep the analysis very general (and as a result superficial, often at an informal gut-feeling-risk level) it is probably possible, but the results often become very subjective and we miss out on the benefits that other methods offer.

As the base for a security design that is resilient to targeted attacks and its subsequent risk based security management (this would require a risk register) of the complete ICS/IACS, I believe it is an impossible task. All results of a risk assessment need to meet the sensitivity test, and the results need to be discriminitive enough to have value. This requires that methods applied, prevent any subjective inputs that steer the results into a specific direction.

If we select a risk assessment approach per function to allow for more detail, we have to take the difference in criticality of the function into account when comparing risk of different functions. This is of minor importance when we compare risk results from SIS (Safety Instrumented System) or BPCS (Basic Process Control System), because both are of vital importance in a criticality analysis. But we will already see differences in results when we would compare BPCS with MMS (Machine Monitoring System), IAMS (Instrument Asset Management System) or DAHS (Data Acquisition Historian System).


As I already mentioned in my previous blog, risk assessment methodologies have evolved and the method suggested by ISA 62443-3-2 seems to drive toward an approach that can’t handle the challenges of today’s IACS. Certainly not for the targeted attacks where threat actors with “IACS specific skills” ( SL 3, SL 4). To properly execute a risk assessment in an OT environment requires knowledge on the different methods for assessing risk, their strong and weak points, and above all a clear objective for the selected method.

So to conclude my assessment of the second step of the ISA 62443-3-2 process, “Initial risk assessment”, I feel the task group missed too much in this step. The result offers too little, is incomplete and actually providing very little useful information for the next steps, among which the “security zone partitioning”.

Now lets look at the zone partitioning step, to see how the standard and my field experience aligns here.


First of all what is the importance of security zone partitioning with regard to security risk assessment?

  • If we want to use zone risk we need to know the boundaries of the security zone;
  • For asset risk and threat based risk we need to know the exposure of the asset / channel and connectivity between zones over conduits is an important factor.

So it is an important step in a security risk assessment, even for none security standard based strategies. Let’s start with the overview of what project steps the standard specifies:

  • Establish zones and conduits;
  • Separate business and ICS/IACS assets;
  • Separate safety related assets;
  • Separate devices that are temporarily connected;
  • Separate wireless devices;
  • Separate devices connected via external networks.

Looks like a logical list to consider when creating security zones, but certainly not a complete list. The list seems to be driven by exposure, which is good. But there are other sources of exposure. We can have 24×7 manned and unmanned locations, important for yes / no a session lock of operator stations, so a security characteristic. We have to consider the strength of the zone boundary, is it a physical perimeter (e.g. network cable connected to the port of a firewall), a logical perimeter (e.g. a virtual LAN), or do we have a software defined perimeter (e.g. a hypervisor that separates virtual machines on virtual network segments).

The standard, and as far as I am aware none of the other ISA standards, consider virtualization. This is a surprise for me because virtualization seems to be core for the majority of greenfield projects, and even as part of brown field upgrade projects virtualization is a frequent choice today. Considering that the standard is issued April 2020, and ISA has a policy to refresh standards every 5 years, this is a major gap because software zone perimeters for security zones is an important topic.

Considering that virtualization is a technology used in many new installations, and considering the changes that technology like APL and IIoT are bringing us. Not addressing these technologies in a risk based design document that discusses zone partitioning makes the standard almost obsolete in the year it is issued.

Perhaps a very hard verdict, but a verdict based on my personal experience where 4 out of 5 large greenfield projects were based on virtualized systems a subject that should have been covered. Ignoring virtualization for zone partitioning is a major gap in 2020 and the years to come.

There is a whole new “world” today of virtual machine hosts, virtual machines, hardware clusters, and software defined perimeters. And this has nothing to do with the world of private clouds or Internet based clouds, virtualization is proven technology for at least 5+ years now, conquering ICS/IACS space with increasing speed. It should not have been missed.

The 62443-3-2 standard is not very specific with regard to the other subjects in this step, so little reason for me to criticize the remainder of the text. If I have to add a point, then I might say that the paragraph on separating safety and non-safety related assets is very thin. I would have expected a bit more in April 2020, plenty of unanswered design questions for this topic.


The next step the standard asks us to do is “risk comparison“, we have to compare initial risk (step 2) with residual risk, the risk after the zone partitioning step. There is the “little” issue that neither in the initial risk assessment step, nor in the zone partitioning step we estimate risk. Nor do we establish anywhere risk criteria, important information when we want to compare risk.

Zone partitioning does change the risk, we influence exposure through connectivity, but there is no risk estimated in the partitioning step. Perhaps the idea is to take the asset with the highest risk in the zone and use this for the SL-T / SL-C and identify missing security requirements, but this is not specified and would be an iterative process because also asset risk depends among others on exposure from connectivity.

I had expected something in the partitioning task that would estimate / identify zone risk and assign the zone a target security level using some transformation matrix from risk to security level. The standard doesn’t explain this process, it doesn’t seem to be an activity of the zone partitioning task, it doesn’t refer to another standard document for solving it. Which is an omission in my opinion.

But ok no problem, if we can’t accept the residual risk we are going to do the next step, the detailed risk assessment and keep iterating till we accept the residual risk. So perhaps I must read this more as a first step in an evaluation loop. Doesn’t take away that if I decide first time I am happy with the residual risk, I will have nothing else than what the initial risk assessment produced, and this was not cyber security risk.


The fifth step is the detailed risk assessment. Let’s see what we need to do:

  • Identify cyber security threats;
  • Identify vulnerabilities;
  • Determine consequences and impact;
  • Determine unmitigated likelihood;
  • Determine unmitigated cyber security risk;
  • Determine security level target to link to the IEC 62443-3-3 standard.

If the unmitigated risk exceeds tolerable risk we need to continue with mitigation. Following steps are defined:

  • We need to identify and evaluate existing countermeasures;
  • We are asked to reevaluate the likelihood based on these existing countermeasures;
  • Determine the new residual risk;
  • Compare residual risk against tolerable risk and reiterate the cycle if the residual risk is still too high;
  • If all residual risk is below the tolerable risk, we document the results in the risk assessment report.

To do all of the above we need to have risk criteria, these are not mentioned in the standard neither is mentioned what criteria there are. The standard seems to adopt the three risk levels often used for process safety: acceptable risk, tolerable risk, and unacceptable risk.

Unfortunately this is too simple for cyber security risk. When process safety risk is unacceptable, an accepted policy is too stop and fix it before continuing. For tolerable risk there would be a plan in place on how to improve it when possible.

Cyber security doesn’t work that way, I have seen many high cyber security risks, but only in a few cases noted that plant managers were willing to accept a loss (production stop) to fix it. An example where loss because of security risk was accepted was when Aramco and 2 weeks later Qatar gas were attacked by the Shamoon malware. At that time the regional governments instructed the plants to disconnect the ICS/IACS from their corporate network, this induces extra cost. We have seen similar decisions caused by ransomware infections, plants pro-actively stopping production to prevent an infection propagating.

Cyber security culture differs from process safety culture, this translates into risk criteria and the action-ability of risk. The less risk levels, the more critical the decision. As result, plants seem to have a preference for 5 or 6 risk levels. This allows them a bit more flexibility.

Tolerable risk is the “area” between risk appetite and risk tolerance. Risk appetite being the level we can continue production without actively pursuing further risk reduction, and risk tolerance being the limit above which we require immediate action. Risk criteria are important, in the annex ISA 62443-3-2 provides some examples in risk matrices. A proper discussion on risk criteria is missing. Likelihood levels, severity levels, impact levels, importance levels all need to be defined. It is important that if we say this is a high risk, all involved understand what this means. Also actions need to be defined for a risk level, risk needs to result into some action if it exceeds a level.

The standard limits itself to business risk, impact expressed as a loss. Business risk is great to justify investment but does very little for identifying the most important mitigation opportunities because it is a worst case risk. It is like saying if I am walking in a thunderstorm I can die from being struck by lightning, so I no longer need to analyze the risk using a zebra to cross the road.

Another point of criticism I have is why only risk reduction based on likelihood reduction is considered. The standard seems to ignore addressing opportunities on the impact side for taking away consequences? Reduction on the consequence side has proved to be far more effective. In the methodology chosen by the standard this is not possible because the only impact / consequence recognized is the ultimate business impact. The consequences leading to this impact, the functional deviation in IACS functions, are not considered.

Risk event path

The three step process described in above block diagram of risk and shown in more detail in my previous blog as the “event path” doesn’t exist for the ISA adopted method. Though it are the countermeasures and safeguards we use to reduce the cyber security risk.

For example there are many plants that do not allow the use of the Modbus TCP/IP protocol for switching critical process functions using PLCs that depend on Modbus communication. If such an action is required they hardwire the connection to prevent being vulnerable for various Modbus TCP/IP message injection and modification attacks. This is a safeguard taking a way a very critical consequence such as an unauthorized start or stop of a motor, compressor or other by injecting a Modbus message.

Another point we are asked to do is to determine the security level target (SL-T). Well assuming there is some transformation matrix converting risk into security level (not in the ISA 62443-3-2) we can do this, but how?

It is a repeating issue, the standard doesn’t explain if I need to use zone risk like ANSSI does, or determine zone risk as the asset with the maximum risk in a zone. And when I have risk what would be the SL-T?

Once we have an SL-T we can compare this with the security level capability (SL-C) to get the security requirements from the IEC 62443-3-3. ISA 62443-3-2 seems to be restrict to the standard based security strategy. A good point to start but not a solution for critical infrastructure.

ISA 62443 3-2 is a standards-based security strategy.

Another surprise I have is the focus on the unmitigated risk, why not include the existing countermeasures immediately? Why are we addressing risk mitigation exclusively by addressing likelihood. Where do we include the assets to protect (equipment, function, channel)? I think I know the answer, the risk methodology adopted doesn’t support it. The task group either didn’t investigate the various risk estimation methodologies available or worked for some reason toward applying a methodology that is not capable of estimating risk for multiple countermeasures / safeguards. Which is strange choice because in process safety this methodology is successfully applied through LOPA.


So how to summarize this pile of criticism? First of all I want to say that this is the standard document I criticize the most, maybe because it is the subject that comes closest to my work. There are always small points where opinions can deviate, but in this case I have the feeling the standard doesn’t offer what it should bring, it seems to struggle with the very concept of risk analysis. Which is amazing because of the progress made by both science and asset owners in recent years.

Because risk is such an essential concept for cyber security I am disappointed in the result, despite all the editing of this blog and the many versions that were deleted I think the blog still shows this disappointment.

It is my feeling that the task group didn’t investigate the available risk methodologies sufficiently, didn’t study the subject of risk analysis, and they didn’t seem to compare results of the different methods. They aimed for one method and wrote the standard around it. That is a pity because it will take another 5 years before we see an update and 5 years in cyber security are an eternity.


There is no relationship between my opinions and references to publications in this blog and the views of my employer in whatever capacity. This blog is written based on my personal opinion and knowledge build up over 42 years of work in this industry. Approximately half of the time working in engineering these automation systems, and half of the time implementing their networks and securing them.


Author: Sinclair Koelemij

OTcybersecurity web site

Playing chess on an ICS board


Abstract

This week’s blog discusses what a Hazard and Operability study (HAZOP) is and some of the challenges (and benefits) it offers when applying the method for OT cyber security risk. I discuss the different methods available, and introduce the concept of counterfactual hazard identification and risk analysis. I will also explain what all of this has to do with the title of the blog, and I will introduce “stage-zero-thinking”, something often ignored but crucial for both assessing risk and protecting Industrial Control Systems (ICS).


What inspired me this week? Well one reason – a response from John Cusimano on last week’s Wake-up call blog.

John’s comment: “I firmly disagree with your statement that ICS cybersecurity risk cannot be assessed in a workshop setting and your approach is to “work with tooling to capture all the possibilities, we categorize consequences and failure modes to assign them a trustworthy severity value meeting the risk criteria of the plant.”.  So, you mean to say that you can write software to solve a problem that is “impossible” for people to solve.  Hm. Computers can do things faster, true. But generally speaking, you need to program them to do what you want. A well facilitated workshop integrates the knowledge of multiple people, with different skills, backgrounds and experience. Sure, you could write software to document and codify some of their knowledge but, today, you can’t write a program to “think” through these complex topics anymore that you could write a program to author your blogs.”

Not that I disagree with the core of John’s statement, but I do disagree with the role of the computer in risk assessment. LinkedIn is a nice medium, but responses always are a bit incomplete, and briefness isn’t one of my talents. So a blog is the more appropriate place to explain some of the points raised. Why suddenly an abstract? Well this was an idea of a UK blog fan.

I write my blogs not for a specific public, though because of the content, my readers most likely are involved in securing ICS. I don’t think the “general public” public can digest my story easily, so they probably quickly look for other information when my blog lands in their window or they read it till the end and think what was this all about. But there is a space between the OT cyber security specialist, and the general public. I call this space “sales” technical guys but at a distance, and with the thought in mind that “if you know the art of being happy with simple things, then you know the art of having maximum happiness with minimum effort”, I facilitate the members of this space by offering a content filter rule – the abstract.


The process safety HAZOP or Process Hazard Analysis as non-Europeans call the method, was a British invention in the mid-sixties of the previous century. The method accomplished a terrific breakthrough in process safety and made the manufacturing industry a much safer place to work.

How does the method work? To explain this I need to explain some of the terminology I use. A production process, for example a refinery process, is designed creating successive steps of detail. We start with what is called a block flow diagram (BFD), each block represents a single piece of equipment or a complete stage in the process. Block diagrams are useful for showing simple processes or high level descriptions of complex processes.

For complex processes the BFD use is limited to showing the overall process, broken down into its principal stages. Examples of blocks are a furnace, a cooler, a compressor, or a distillation column. When we add more detail on how these blocks connect, the diagram is called a process flow diagram. A process flow diagram (PFD) shows the various product flows in the production process, an example of a PFD is the next text book diagram of a nitric acid process.

Process Flow Diagram. (Source Chemical Engineering Design)

We can see the various blocks in a standardized format. The numbers in the diagram indicate the flows, these are specified in more detail in a separate table for composition, temperature, pressure, … We can group elements in what we call process units, logical groups of equipment that accomplish together a specific process stage. But what we are missing here is the process automation part, what do we measure, how do we control the flow, how do we control pressure? This type of information is documented in what is called a piping and instrument diagram (P&ID).

The P&ID shows the equipment numbers, valves, the line numbers of the pipes, the control loops and instruments with an identification number, pumps, etc. Just like for PFDs we also used use standard symbols in P&IDs to describe what it is, to show the difference between a control valve and a safety valve using different symbols. The symbols for the different types of valves already covers more than a page. If we look at the P&ID of the nitric acid process and zoom into the vaporizer unit we see that more detail is added. Still it is a simplified diagram because the equipment numbers and tag names are removed, alarms have been removed, and there are no safety controls in the diagram.

The vaporizer part of the P&ID (Source Chemical Engineering Design)

On the left of the picture we see a flow loop indicated with FIC (the F from flow, the I from indicator, and the C from control), on the right we see a level control loop indicated with (LIC). We can see which transmitters are used to measure the flow (FT) or the level (LT). We can see the that control valves are used (the rounded top of the symbol). Though above is an incomplete diagram, it shows very well the various elements of a vaporizer unit.

Similar diagrams, different symbols and of course a totally different process, exist for power.

When we engineer a production / automation process P&IDs are always created to describe every element in the automation process. When starting an engineering job in the industry, one of the first things to learn is this “alphabet” of P&ID symbols the communication language for documenting the relation between the automation system (the ICS) and the physical system. For example the FIC loop will be configured in a process controller, there will be “tagnames” assigned to each loop, graphic displays created so the process operator can track what is going on and intervene when needed. Control loops are not configured in a PLC, process controllers and PLCs are different functions and have a different role in an automation process.


So far the introduction for discussing the HAZOP / PHA process. The idea behind a HAZOP is that we want to investigate: What can go wrong; What the consequence of this would be for the production process; And how we can enforce that if it goes wrong the system is “moved” to a safe state (using a safeguard).

There are various analysis methods available, I discuss the classical method because this is similar to what is called a computer HAZOP and like the method John suggests. The one that is really different, counterfactual analysis, and is especially used for complex problems like OT cyber security for ICS I discuss last.

A process safety HAZOP is conducted in a series of workshop sessions with participation of subject matter experts of different disciplines (Operations, safety, maintenance, automation, ..) and led by a HAZOP “leader”, someone not necessarily a subject matter expert on the production process but a specialist in the HAZOP process it self. The results of HAZOPs are as good as the participants and even with very knowledgeable subject matter experts and an inexperienced HAZOP leader results might be bad. Experience is a key factor in the success of a HAZOP.

The inputs for the HAZOP sessions are the PFDs and P&IDs. P&IDs typically represent a process unit but if this is not the case, the HAZOP team selects a part of the P&ID to zoom into. HAZOP discussions focus on process units, equipment and control elements that perform a specific task in the process. Our vaporizer could be a very small unit with a P&ID. The HAZOP team could analyze the various failure modes of the feed flow using what are called “guide words” to guide the analysis in the topics to analyze. Guide words are just a list of topics used to check a specific condition / state. For example there is a guide word High, and another Low, or No, and Reverse. This triggers the HAZOP team to investigate if it is possible to have No flow, is it possible to have High flow, Low flow, Reverse flow, etc. If the team decides that it is possible to have this condition, for example No Flow, they write down the possible causes that can create the condition. What can cause No flow, well perhaps a cause is a valve failure or a pump failure.

When we have the cause we also need to determine the consequence of this “failure mode”, what happens if we have No flow or Reverse flow. If the consequence is not important we can analyze the next, otherwise we need to decide what to do if we have No flow. We certainly can’t keep heating our vaporizer, so if there is no flow so we need to do something (the safeguard).

Perhaps the team decides on creating a safety instrumented function (SIF) that is activated on a low flow value and shuts down the heating of the vaporizer. These are the safeguards, initially high level specified in the process safety sheet but later in the design process detailed. A safeguard can be executed by a safety instrumented system (SIS) using a SIF and are implemented as mechanical devices. Often multiple layers of protection exist, the SIS being only one of them. A cyber security attack can impact the SIS function (modify it, disable it, initiate it), but this is something else as impacting process safety. Process safety typically doesn’t depend on a single protection layer.

Process safety HAZOPs are a long, tedious, and costly process that can take several months to complete for a new plant. And of course if not done in a very disciplined and focused manner, errors can be made. Whenever changes are made in the production process the results need to be reviewed for their process safety impact. For estimating risk a popular method is to use Layers Of Protection Analysis (LOPA). With the LOPA technique, a semi-quantitative method, we can analyze the safeguards and causes and get a likelihood value. I discuss the steps later in the blog when applied for cyber security risk.

Important to understand is that the HAZOP process doesn’t take any form of malicious intent into account, the initiating events (causes) happen accidentally not intentionally. The HAZOP team might investigate what to do when a specific valve fails closed with as consequence No Flow, but will not investigate the possibility that a selected combination of valves fail simultaneously. A combination of malicious failures that might create a whole new scenario not accounted for.

A cyber threat actor (attacker) might have a specific preference on how the valves need to fail to achieve his objective and the threat actor can make them fail as part of the attack. Apart from the cause being initiated by the threat actor, also the safeguards can be manipulated. Perhaps safeguards defined in the form of safety instrumented functions (SIF) executed by a SIS or interlocks and permissives configured in the basic process control system (BPCS). Once the independence of SIS and BPCS is lost the threat actor has many dangerous options available. There are multiple failure scenarios that can be used in a cyber attack that are not considered in the analysis process of the process safety HAZOP. Therefore the need for a separate cyber security HAZOP to detect this gap and address it. But before I discuss the cyber security HAZOP, I will briefly discuss what is called the “Computer HAZOP” and introduce the concept of Stage-Zero-Thinking.

A Computer HAZOP investigates the various failure modes of the ICS components. It looks at the power distribution, operability, processing failures, network, fire, and sometimes at a high level security (can be both physical as well as cyber security). It might consider malware, excessive network traffic, a security breach. Generally very high level, very few details, incomplete. All of this is done using the same method as used for the process safety HAZOP, but the guide words are changed. In a computer HAZOP we work now with guide words such: “Fire”, Power distribution” “Malware infection”, etc. But still document the cause, consequence, and consider safeguards in a similar manner as for the process safety HAZOP. Consequences are specified at high level such as loss of view, loss of control, loss of communications, etc.

At a level we can judge their overall severity but not link it to detailed consequences for the production process. Cyber security analysis at this level would not have foreseen such advanced attack scenarios as used in the Stuxnet attack, it remains at a higher level of attack scenarios. The process operator at the Natanz facility also experienced a “Loss of View”, a very specific one the loss of accurate process data for some very specific process loops. Cyber security attacks can be very granular, requiring more detail than consequences as “Loss of View” and “Loss of Control” offer, for spotting the weak link in the chain and fix it. If we look in detail how an operator HMI function works we soon end up with quite a number of scenarios. The path between the finger tips of an operator typing a new setpoint and the resulting change of the control valve position is a long one with several opportunities to exploit for a threat actor. But while threat modelling the design of the controller during its development many of these “opportunities” have been addressed.

The more complex the number of scenarios we need to analyze the less appropriate the execution of the HAZOP method in the traditional way is because of the time it takes and because of the dependence on subject matter experts. Even the best cyber security subject matter specialists can miss scenarios when it is complex, or don’t know about these scenarios because they don’t have the knowledge of the internal workings of the functions. But before looking at a different, computer supported method, first an introduction of “stage-zero-thinking”.


Stage-zero refers to the ICS kill chain I discussed in an earlier blog where I tried to challenge if an ICS kill chain always has two stages. A stage 1 where the threat actor collects the specific data he needs for preparing an attack on the site’s physical system, and a second stage where actual attack is executed. We have seen these stages in the Trisis / Triton attack , where the threat actors attacked the plant two years before the actual attempt collect information in order to attack a safety controller for modifying the SIS application logic.

What is missing in all descriptions of TRISIS attack so far is stage 0, the stage where the threat actor made his plans to cause a specific impact on the chemical plant. Though the “new” application logic created by the threat actors must be known (part of the malware), it is nowhere discussed what the differences were between the malicious application logic and the existing application logic. This is a missed opportunity because we can learn very much from understanding rational behind the attackers objective. Generally objectives can be reached over multiple paths, fixing the software in the Triconex safety controller might have blocked one path but it is far from certain if all paths leading to the objective are blocked.

For Stuxnet we know the objective thanks to the extensive analysis of Ralph Langner, the objective was manipulation of the centrifuge speed to cause excessive wear of the bearings. It is important to understand the failure mode (functional deviation) used because this helps us to detect it or prevent it. For the attack on the Ukraine power grid, the objective was clear … causing a power outage .. the functional deviation was partially unauthorized operation of the breaker switches and partially the corruption of protocol converter firmware to prevent the operator to remotely correct the action. This knowledge provides us with several options to improve the defense. Another attack, the attack on the German Steel mill the actual method used is not known. They gained access using a phishing attack but in what way the attacker caused the uncontrolled shutdown is never published. The objective is clear but the path to it not, so we are missing potential ways to prevent it in future. Just preventing unauthorized access is only blocking one path, it might still be possible to use malware to do the same. In risk analysis we call this the event path, the longer we oversee this event path the stronger our defense can be.

Attacks on cyber physical systems have a specific objective, some are very simple (like the ransomware objective) some are more complex to achieve like the Stuxnet objective or in power the Aurora objective. Stage-zero-thinking is understanding which functional deviations in the ICS are required to cause the intended loss on the physical side. The threat actor starts at the end of the attack and plans an event path in the reverse direction. For a proper defense the blue team, the defenders, needs to think like the red team. If they don’t they will always be reactive and often too late.

The first consideration of the Stuxnet threat actor team must have been how to impact the uranium enrichment plant to stop doing what ever they were doing. Since this was a nation state level attack there were of course kinetic options, but they selected the cyber option with all consequences for the threat landscape of today. Next they must have been studying the production process and puzzling how to sabotage it. In the end they decided that the centrifuges were an attractive target, time consuming to replace and effectively reducing the plant’s capacity. Than they must have considered the different ways to do this, and decided on making changes in the frequency converter to cause the speed variations responsible for the wear of the bearings. Starting at the frequency converter they must have worked their way back toward how to modify the PLC code, how to hide the resulting speed variations from the process operator, etc, etc. A chain of events on this long event path.

in the scenario I discussed in my Trisis blog I created the hypothetical damage through modifying a compressor shutdown function and subsequently initiating a shutdown causing a pressure surge that would damage the compressor. Others suggested the objective was a combined attack on the control function and process safety function. All possible scenarios, the answer is in the SIS program logic not revealed. So no lesson learned to improve our protection.

My point here is that when analyzing attacks on cyber physical systems we need to include the analysis of the “action” part. We need to try extending the functional deviation to the process equipment. For many process equipment we know the dangerous failure modes, but we should not reveal them if we can learn from them to improve the protection. This because OT cyber security is not limited to implementing countermeasures but includes considering safeguards. In IT security, there is a focus on the data part for example: the capturing of access credentials; credit card numbers; etc.

In OT security need to understand the action, the relevant failure modes. As explained in prior blogs, these actions are in the two categories I have mentioned several times: Loss of Required Performance (deviating from design or operations intent) and Loss of Ability to Perform (the function is not available). I know that many people like to hang on to the CIA or AIC triad, or want to extend, the key element in OT cyber security are these functional deviations that cause the process failures to address these on both the likelihood and impact factors we need to consider the function and than CIA or AIC is not very useful. The definitions used by the asset integrity discipline offer us far more.

Both loss of required performance and loss of ability to perform are equally important. Causing the failure modes linked to loss of required performance the threat actor can initiate the functional deviation that is required to impact the physical system, with failure modes associated with the loss of ability to perform the threat actor can prevent detection and / or correction of a functional deviation or deviation in the physical state of the production process.

The level of importance is linked to loss and both categories can cause this loss, it is not that Loss of Performance (kind of equivalent of the IT integrity term) or Loss of Ability to Perform (The IT availability term) cause different levels of loss. The level of loss depends on how the attacker uses these failure modes to cause the loss, a loss of ability can easily result in a runaway reaction without the need of manipulation of the process function, some production processes are intrinsically unstable.

All we can say is that loss of confidentiality is in general the least important loss if we consider sabotage, but can of course lead to enabling the other two if it concerns confidential access credentials or design information.

Let’s leave the stage-zero-thinking for a moment and discuss the use of the HAZOP / PHA technique for OT cyber security.


I mentioned it in previous blogs, a cyber attack scenario can be defined as:

A THREAT ACTOR initiates a THREAT ACTION exploiting a VULNERABILITY to achieve a certain CONSEQUENCE.

This we can call an event path, a sequence of actions to achieve a specific objective. A threat actor can chain event paths, for example in the initial event path he can conduct a phishing attack to capture login credentials, followed-up by an event path accessing the ICS and causing an uncontrolled shut down of a blast furnace. The scenario discussed in the blog on the German steel mill attack. I extend this concept in the following picture by adding controls detailing the consequence.

Event path

In order to walk the event path a threat actor has to overcome several hurdles, the protective controls used by the defense team to reduce the risk. There are countermeasures acting on the likelihood side (for instance firewalls, antivirus, application white listing, etc.) and we have safeguards / barriers acting on the consequence side to reduce consequence severity by blocking consequences to happen or detect them in time to respond.

In principal we can evaluate risk for event paths if we assign an initiating event frequency to the threat event, have a method to “measure” risk reduction, and have a value for consequence severity. The method to do this is equivalent to the method used in process safety Layer Of Protection Analysis (LOPA).

In LOPA the risk reduction is among others a factor of the probability of demand (PFD) factor we assign to each safeguard, there are tables that provide the values, the “credit” we take for implementing them. The multiplication of safeguard PFDs in the successive protection layers provides a risk reduction factor (RRF). If multiplied with the initiating event frequency we get the mitigated event frequency (MEF). We can have multiple layers of protection allowing us to reduce the risk. The inverse of the MEF is representative for the likelihood and we can use it for the calculation of residual risk. In OT cyber security the risk estimation method is similar, also here we can benefit from multiple protection layers. But maybe in a future blog more detail on how this is done and how detection comes into the picture to get a consistent and repeatable manner for deriving the likelihood factor.


To prevent questions, I probably already explained in a previous blog, but for risk we have multiple estimation methods. We can use risk to predict an event to happen, this is called temporal risk, we need statistical information to get a likelihood. We might get this one day if we have every day an attack on ICS, but today there is not enough statistical data for ICS cyber attacks to estimate temporal risk. So we need another approach, and this is what is called a risk priority number.

Risk priority numbers allow us to rank risk, we can’t predict but we can show which risk is more important than another and we can indicate which hazard is more likely to occur than another. This is done by creating a formula to estimate the likelihood of the event path to reach its destination, the consequence.

If we have sufficient independent variables to score for likelihood, we get a reliable difference in likelihood between different event paths.

So it is far from the very subjective assignment method of a likelihood factor by a subject matter expert as explained by a NIST risk specialist in a recent presentation organized by the ICSJWG. Such a method would lead to a very subjective result. But enough about estimating risk this is not the topic today, it is about the principles used.


Counterfactual hazard identification and risk analysis is the method we can use for assessing OT cyber security risk in a high level of detail. Based on John Cusimano’s reaction it looks like an unknown approach. Though the method is at least 10+ years in every proper book on risk analysis and in use. So what is it?

I explained the concept of the event path in the diagram, counterfactual risk analysis (CRA) is not much more than building a large repository with as many event paths as we can think of and then processing them in a specific way.

How do we get these event paths? One way is to study the activities of our “colleagues” working in threat_community inc. They potentially learn us in each attack they execute one or more new event paths. Another way to add event paths is by threat modelling, at least than we become proactive. Since cyber security also entered the development processes of ICS in a much more formal manner, many new products today are being threat modeled. We can benefit of those results. And finally we can threat model ourselves at system level, the various protocols (channels) in use, the network equipment, the computer platforms.

Does such a repository cover all threats, absolutely not but if we do this for a while with a large team of subject matter experts in many projects the repository of event paths grows very quickly. Learning curves become very steep in large expert communities.

How does CRA make use of such a repository? I made a simplified diagram to explain.

The Threat Actor (A) that wants to reach a certain consequence / objective (O), has 4 Threat Actions (TA) at his disposal. Based on A’s capabilities he can execute one or more. Maybe a threat actor with IEC 62443 SL 2 capabilities can only execute 1 threat action, while an SL 3 has the capabilities to execute all threat actions. The threat action attempts to exploit a Vulnerability (V), however sometimes the vulnerability is protected with a countermeasure(s) (C). On the event path the threat actor needs to overcome multiple countermeasures if we have defense in depth, and he needs to overcome safeguards. Based on which countermeasures and safeguards are in place event paths are yes or no available to reach the objective, for example a functional deviation / failure mode. We can assign a severity level to these failure modes (HIGH, MEDIUM, etc)

In a risk assessment the countermeasures are always considered perfect, there reliability, effectiveness and detection efficiency is included in their PFD. In a threat risk assessment, where also a vulnerability assessment is executed, it becomes possible to account for countermeasure flaws. The risk reduction factor for a firewall that starts with the rule permit any any will certainly not score high on risk reduction.

I think it is clear that if we have an ICS with many different functions (so different functional deviations / consequences, looking at the detailed functionality), different assets executing these functions, many different protocols with their vulnerabilities, operating systems with their vulnerabilities, and different threat actors with different capabilities, the number of event paths grows quickly.

To process this information a CRA hazard analysis tool is required. A tool that creates a risk model for the functions and their event paths in the target ICS. A tool takes the countermeasures and safeguards implemented in the ICS into account, a tool that accounts for the static and dynamic exposure of vulnerabilities, and a tool that accounts for the severity of the consequences. If we combine this with the risk criteria defining the risk appetite / risk tolerance we can estimate risk and can quickly show which hazards have an acceptable risk, tolerable risk, or unacceptable risk.

So a CRA tool builds the risk model through configuring the site specific factors, for the attacks it relies on the repository of event paths. Based on the site specific factors some event paths are impossible, others might be possible with various degrees of risk. More over such a CRA tool makes it possible to show additional risk reduction by enabling more countermeasures. Various risk groupings become possible, for example it becomes possible to estimate risk for the whole ICS if we take the difference in criticality between the functions into account. We might want to group malware related risk by filtering on threat actions based on malware attacks or other combinations of threat actions.

Such a tool can differentiate risk for each threat actor with a defined set of TTP. So it becomes possible to compare SL 2 threat actor risk with SL 3 threat actor risk. Once we have a CRA model many points of view become available, could even see risk vary for the same configuration if the repository grows.

So there is a choice, either a csHAZOP process with a workshop where the subject matter experts discuss the various threats. Or using a CRA approach where the workshop is used to conduct a criticality assessment, consequence analysis, and determine the risk criteria. It is my opinion that the CRA approach offers more value.


So finally what has this all to do with the title “playing chess on the ICS board”? Well apart from a OT security professional I was also a chess player, playing chess in times there was no computer capable of playing a good game.

The Dutch former world champion Max Euwe (also professor Informatics) was of the opinion that computers can’t play chess at a level to beat the strongest human chess players. He thought human ingenuity can’t be put in a machine, this is about 50 years ago.

However large sums of money were invested in developing game theory and programs to show that computers computers can beat humans. The first time that this happened was when an IBM computer program “Deep Blue” won from then reigning world champion Gary Kasparov in 1997. The computers approached the problem brute force in those days, generating for each position all the possible moves, analyzing the position after the move and going to the next level for a new move for the move or moves that scored best. Computers could do this so efficiently that looked 20/30 moves (plies) ahead, far more than any human could do. Humans had to use their better understanding of the position and its weaknesses and defensive capabilities.

But the deeper a computer could look and the better its assessment of the position became the stronger it became. And twenty years ago it was quite normal that machines could beat humans at chess, including the strongest players. This was the time that chess games could not be adjourned anymore because a computer could analyse the position. Computers were used by all top players to check their analysis in the preparation of games, it considerably changed the way chess was played.

Than recently we had the next generation based on AI (E.g. Alpha Zero) and again the AI machines proofed stronger, stronger then the machines making use of the brute force method. But these AI machines offered more, the additional step was that humans started to learn from the machine. The loss was no longer caused by our brains not being able to analyze so many variations, but the computer actually understood the position better. Based upon all the games played by people the computers recognized patterns that were successful and patterns that would ultimately lead to failure. Plans that were considered very dubious by humans were suddenly shown to be very good. So grandmasters learned and adopted this new knowledge even by today’s world champion Magnus Carlsen.

So contrary John’s claim if we are able to model the problem we create a path where computers can conquer complex problems and ultimately be better than us.

CRA is not brute force – randomly generating threat paths – but processing the combined knowledge of OT security specialists with detailed knowledge of the inner workings of the ICS functions contained in a repository. Kind of the patterns recognized by the AI computer.

CRA is not making chess moves on a chess board, but verifying if an event path to a consequence (Functional deviation / failure mode) is available. An event path is a kind of move, it is a plan to a profitable consequence.

Today CRA uses a repository made and maintained by humans, but I don’t exclude it that tomorrow AI assisting us to consider which threats might work and which not. Maybe science fiction, but I saw it happen with chess, Go, and many other games. Once you model a problem computers have proofed to be great assistants and even proofed to be better than humans. CRA exists today, an AI based CRA may exist tomorrow.


So in my opinion the HAZOP method in the form applied to process safety and in computer HAZOPs leads to a generalization of the threats when applied for cyber security because of the complexity of the analysis. Generalization leads to results comparable with security standard-based or security-compliance-based strategies. For some problems we just don’t need risk, if I cross a street I don’t have to estimate the risk. Crossing in a straight line – shortest path – will reduce the risk. The risk would be mainly how busy the road is.

For achieving the benefits of a risk based approach in OT cyber security we need tooling to process all the hazards (event paths) identified by threat modelling. The more event paths we have in our brain, the repository, the more value the analysis produces. Counter fact risk analysis is the perfect solution for achieving this, it provides a consistent detailed result allowing for looking at risk from many different viewpoints. So computer applications offer significant value, by offering a more in depth analysis, for risk analysis if we apply the right risk methodology.


There is no relationship between my opinions and references to publications in this blog and the views of my employer in whatever capacity. This blog is written based on my personal opinion and knowledge build up over 42 years of work in this industry. Approximately half of the time working in engineering these automation systems, and half of the time implementing their networks and securing them.


Author: Sinclair Koelemij

OTcybersecurity web site

A wake-up call


Process safety practices and formal safety management systems have been in place in the industry for many years. Process safety management has been widely credited for reductions in the number of major accidents, proactively saving hundreds of lives and improving industry performance.

OT cyber security, the cyber security of process automation systems such as used by the industry, has a lot in common with the management of process safety and we can learn very much from the experience of formal safety management, build over more than 60 years. Last week I saw a lengthy email chain on a question “if the ISA 99 workgroup (the developers of the IEC 62443 standard) should look for a closer cooperation with the ISO 27001 developers to better align the standards”. Of course such a question results in discussions addressing the importance of ISO 27001 and others emphasizing the difficulties to apply the standard in the industry.

If there is a need for ISA to cooperate with another organization for aligning its standard, than in my opinion they should have a more close cooperation with the AIChE, the ISA of the chemical engineering professionals. The reason for this is that there is a lot to learn from process safety and though IEC 62443 is supposed to be a standard for industrial control systems, there is still a lot of “IT methodology” in the standard.

In this week’s blog I like to address the link between process safety and cyber security again, and discuss some of the lessons in process safety we can (actually should in my opinion) learn from. Not for adding safety to the security triad as some suggest, this is in my opinion for multiple reasons wrong, but because process safety management and OT cyber security management have many things in common when we compare their design and management processes and process safety management is much further in its development than OT cyber security management.

I accomplished in my career several cyber security certifications such as: CISSP, CISM, CRISC, ISO 27001 LA and many more with a pure technical focus. Did all this course material ever discuss industrial control systems (ICS)? No they didn’t, still they where very valuable for developing my knowledge. As an employee working for a major vendor of ICS solutions, my task became more to adopt what was applicable, learn from IT and park those other bits of knowledge for which I saw no immediate application. As my insights further developed I started to combine bits and pieces from other disciplines more easily. In the OT cyber security world, which is relatively immature, we can learn a lot from more mature disciplines such as process safety management. Such learning generally requires us to make adaptions to address the differences.

But despite these differences we can learn from studying the accomplishments of the process safety discipline, this will certainly steepen the learning curve of OT cyber security to make it more mature. If we want to learn from process safety, where better to start than the many publications of CCPS (Center for Chemical Process Safety) and the AIChE.


Process safety starts at risk, process safety studies the problem first before they attempt to solve the problem. Process safety recognizes that all hazards and risk are not equal, consequently it focuses more resources on higher hazards and risks. Does this also apply to cyber security, in my opinion very sparingly.

More mature asset owners in the industry adopted a risk approach in their security strategy, but the majority of asset owners is still very solution driven. They decide on purchasing solutions before they inventoried the cyber security hazards and prioritized them.

What are the advantages of a risk based approach? Risk allows for optimally apportioning limited resources to improve security performance. Risk also provides a better insight in where the problems are and what options there are to solve a problem. Both OT cyber security risk and process safety risk are founded on four pillars:

  • Commit to cyber security and process safety – A workforce that is convinced that their management fully supports a discipline as part of its core values will tend to follow process even when no one else is checking this.
  • Understand hazards and risk – This is the foundation of a risk based approach, it provides the required insight to make justifiable decisions and apply limited resources in an effective way. This fully applies for both OT cyber security and process safety.
  • Manage risk – Plants must operate and maintain the processes that pose risk, keep changes to those processes within the established risk tolerances, and prepare for / respond to / manage incidents that do occur. Nothing in here that doesn’t apply for process safety as well as OT cyber security.
  • Learn from experience – If we want to improve, and because of the constantly changing threat landscape we need to improve, we need to learn. Learning we do by observing and challenging what we do. Metrics can help us here, preferably metrics that provide us with leading indicators so we see the problem coming. Also this pillar applies for both disciplines, where process safety tracks near misses OT cyber security can track parameters such as AV engines detecting malware, or firewall rules bouncing off traffic attempting to enter the control network.

Applying these four pillars for OT cyber security would in my opinion significantly improve OT cyber security over time. Based upon what I see in the field, I estimate that less than 10 percent of the asset owners adopted a risk based methodology for cyber security, while more than 50 percent adopted a risk based methodology for process safety or asset integrity.

If OT cyber security doesn’t want to learn from process safety, it will take another 15 years to reach the same level of maturity. If this happens we are bound to see many serious accidents in future, including accidents with casualties. OT cyber security is about process automation lets use the knowledge other process disciplines build over time.


The alternative for a risk based approach is a compliance based approach, well known examples are for North America the NERC CIP standard, and for Europe the French ANSSI standard for cyber security or if we look at process safety the OSHA regulations in the US. All compliance driven initiatives. A compliance driven approach can lead to:

  • Decisions based upon ” If it isn’t a regulatory requirement, we are not going to do it”.
  • The wrong assumption that stopping the more frequent and easier to measure incidents (like for example the mentioned malware detection) discussed in standards will also stop the low-frequency / high consequence incidents.
  • Inconsistent interpretation and application of the practices described in the standard. Standards are often a compromise between conflicting opinions, resulting in soft requirements open for different interpretations.
  • Overemphasized focus on the management system, forgetting about the technical aspects of the underlying problems.
  • Poor communication between the technically driven staff and the business driven senior management, resulting in management not understanding the importance of the messages they receive and subsequently fail to act.
  • High auditing costs, where audits focus on symptoms instead of underlying causes.
  • Not moving with the flow of time. Technology is continuously changing, posing new risk to address. Risk that is not identified by a standard developed even as recent as 5 years ago.

This criticism on a compliance approach doesn’t mean I am against standards and their development. Merely I am against standards as an excuse to switch off our brain, close our eyes and ignore where we differ from the average. Risk based processes offer us the foundation to stay aware of all changes in our environment while still using standards as a checklist to make certain we don’t forget the obvious.

The four available strategies

Like I mentioned for cyber security the majority of the asset owners would fall in the category standards-based or compliance-based. It is a step forward compared to 10 years ago, when OT cyber security was ignored by many, but it is a long way off from where asset owners are for process safety.

Where we see in process safety the number of accidents decline, we see in cyber security that both the threat event frequency and the threat capability of the threat community rise. To keep up with the growing threat, critical infrastructure should adopt a risk based strategy to keep track with the threat community. Unfortunately many governments are driving for a compliance based strategy because they can more easily audit this and doing this they are setting the requirements too low for a proper protection against the growing threat.

A risk based approach doesn’t exclude compliance with a standard, it just makes the extra step predicting the performance of the various cyber security aspects, independent of any loss events, and improving its security. As such it adds pro-activity to the defense and allows us to keep track with the threat community.

The process safety community recognized the bottlenecks of a compliance based strategy and jumped forward by introducing a risk based approach allowing them to further reduce the number of process safety accidents after several serious accidents happened in the 1980s. Accidents caused by failure of the compliance based management systems.

Because of the malicious aspects inherent to cyber security, because of the fast growing threat capabilities of the threat community and because of an increase in threat events, not jumping to a risk based strategy like the process safety community did is waiting for the first casualties to occur as a result of a cyber attack. TRISIS had the potention be the first attack causing loss of life, we were lucky it failed. But the threat actors have undoubtedly learned from their failure and work on an improved version.

I don’t include the alleged attack on a Siberian pipeline in 1982 as a cyber event as some do. If such an event would happen due to a cyber attack this would be an act of war. So for me we have been lucky so far that cyber impact was mainly a monetary value, but this can change either willingly or accidentally.


It would become a very lengthy blog if I would discuss each of the twenty elements of the risk based safety program or reliability program. But each of these elements has a strong resemblance with what would be appropriate for a cyber security program.

The element I like to jump to is the Hazard Identification and Risk Analysis (HIRA) element. HIRA is the term used to bundle all activities involved in identifying hazards and evaluating the risk induced by these hazards. In my previous blog on risk I showed a more detailed diagram for risk, splitting it in three different forms of risk. For this blog I like to focus on the the hazard part using the following simplified diagram for the same three forms of risk.

Simplified risk model

On the left side we have the consequence of the cyber security attack, some functional deviation of the automation system. This is what was what was categorized as loss of required performance and loss of ability to perform. The 3rd category, loss of confidentiality, will not lead directly to a process risk so I ignore it here. Loss of required performance caused the automation system to either execute an action that should not have been possible (not meeting design intent) or an action that does not perform as it should (not meeting operation intent). In the case of loss of ability to perform, the automation system could not execute one or more of its functions.

So perhaps the automation system’s configuration was changed in a way that the logical dimensions configured in the automation system no longer represent the physical dimensions of the equipment in the field. For example if the threat actor increases the level range of a tank this does not result into a bigger physical tank volume, so a possibility exists that the tank is overfilled without the operator noticing this in his process displays. The logical representation of the physical system (its operating window) should fit the physical dimensions of the process equipment in the plant. If this is not the case this would be the failure mode “Integrity Operating Window (IOW) deviation” in the “Loss of Required Performance” category.

Similar the threat actor might prevent the operator to stop or start a digital output, the failure mode “Loss of Controllability” in the category “Loss of Ability to Perform”. Not being able to stop or start a digital output might translate to the inability to stop or start a pump in the process system. At least stopping or starting by using the automation system. We might have implemented an electrical switch (safeguard) to do it manually if the automation system would fail.

Not being able to modify a control parameter would give rise to a whole other category of issues for the production process. Each failure mode has a different consequence for the process system equipment and the production process.

Cyber security hazards are a description of a threat actor (threat community) executing a threat event (threat action exploiting a vulnerability) resulting in a specific consequence (the functional deviation) entering a specific failure mode for the automation system function. What the consequence is for the production process and its equipment depends on the automation system function affected and the characteristics of the production system equipment and production process. This area is investigated by the process (safety) hazards. Safety is here between brackets because not every functional deviation results in a consequence for process safety, there can also be consequences for product quality or production loss not impacting process safety at all. If the affected function would be the safety instrumented system (SIS), a deviation in functionality would always affect process safety.

The HIRA for process risk would focus on how the functional deviations influence the production process and the asset integrity of its equipment. As such the HIRA has a wider scope than it would have in a typical process safety hazard analysis / hazop. For cyber security it combines what we call the computer hazop, the analysis of how failures in the automation system impact the production system and the process safety hazop.

On the other hand from a safeguard perspective of the safety hazop / PHA the scope is smaller because we can only influence the functionality of the “functional safety” functions provided by the SIS. Safety has multiple layers of protection and multiple safeguards and barriers that contain a dangerous situation. A cyber security attack can only impact the programmable electronic components (e.g. SIS) of the process safety protection functions.

This is the reason why I protest if people talk about “loss of safety” in the context of cyber security, there are in general more protection mechanism implemented, so safety is not necessarily lost. Adding safety to the triad is also incorrect in my opinion, this should be at minimum adding functional safety because that is the only safety layer that can be impacted by a cyber threat event, but functional safety is also already covered within the definition of loss of required performance.

IEC 62443’s loss of system integrity is not covering all the failure modes covered by loss of required performance. The IEC 62443-1-1 defines integrity as: “Quality of a system reflecting the logical correctness and reliability of the operating system, the logical completeness of the hardware and software implementing the protection mechanisms, and the consistency of the data structures and occurrence of the stored data.”

This definition is fully ignoring the functional aspects in an automation system, therefore it is a too limited cyber security objective for an automation system. For example where do we find in the definition that an automation action needs to be performed on the right moment in the right sequence and appropriately coordinated with other functions.

Consider for example the coordination / collaboration between a conveyor and filling mechanism or a robot. The IEC 62443 seven foundation requirements don’t cover all aspects of an automation function / industrial control system. The combined definitions used by risk based asset integrity management and risk based process safety management do cover these aspects, an example of a missed chance to learn something from an industry that has considerably more experience in its domain than the OT cyber security community has in its own field.


Can we conduct the HIRA process for cyber security in a similar way as we do for process safety? My only answer here is a firm NO!. The malicious aspects of cyber security make it impossible to work in the same way as we do for process safety. The job would just not be repeatable (so results are not consistent) and too big (so extremely time consuming). The number of possible threat events, vulnerabilities, and consequences is just too big to approach this in a workshop setting as we do for process hazard analysis (PHA) / safety hazop.

So in cyber security we work with tooling to capture all the possibilities, we categorize consequences and failure modes to assign them a trustworthy severity value meeting the risk criteria of the plant. But in the end, we end with a risk priority number just like we have in risk based process safety or risk based asset integrity to rank the hazards.

The formula for cyber security risk is more complex because we not only have to account for occurrence (threat x vulnerability) and consequence, but also for detection, and the risk reduction provided by countermeasures, safeguards and barriers. But these are normal deviations, also risk based asset integrity management and risk based process safety management differ at detail level.


The following key principles need to be addressed when we develop, evaluate, or improve any management system for risk:

  • Maintain a dependable and consistent practice – So the practice should be documented, the objectives of the benefits must be in terms that demonstrate to management and employees the value of the activities;
  • Identify hazards and evaluate risks – Integrate HIRA activities into the life cycle of the ICS. Both design and security operations should be driven by risk based decisions;
  • Assess risks and make risk based decisions – Clearly define the analytical scope of HIRAs and assure adequate coverage. A risk system should address all the types of cyber security risk that management wants to control;
  • Define the risk criteria and make risk actionable – It is crucial that all understand what a HIGH risk means, and that it is defined what the organization will do when something attains this level of risk. Risk appetite differs depending on the production process or process units within that process;
  • Follow through on risk assessment results – Involve competent personnel, make a consistent risk judgement so we can follow through without too much debate if results require this;

Risk diagrams to express process risk generally have less risk levels as a risk assessment diagram for cyber security. This because it has a more direct relationship with the business / mission risk, so actions have a direct business justification. An example risk assessment diagram for process risk is shown in the following diagram:

Risk assessment diagram for process risk example

The ALARP acronym stands for As Low As Reasonably Practicable a commonly used criterion for process related risk. Once we have the cyber security hazards and their process consequence we can assign a business impact to each hazard and create risk assessment matrices for each impact category as explained in my blog on OT cyber security risk using the impact diagram as example. or if preferred the different impact categories can be shown in a single risk assessment matrix.

Mission impact example

So far this discussion about the parallels between risk based process safety, risk based asset integrity, and risk based OT cyber security. I noticed in responses to previous blogs, that for many this is an uncharted terrain because they might not be familiar with all three disciplines and the terminology used. Most risk methods used for cyber security have an IT origin. This results in ignoring the action part of an OT system, OT being Data + Action driven where IT is Data driven only. Another reason to more closely look at other risk based management processes applied in a plant.


There is no relationship between my opinions and references to publications in this blog and the views of my employer in whatever capacity. This blog is written based on my personal opinion and knowledge build up over 42 years of work in this industry. Approximately half of the time working in engineering these automation systems, and half of the time implementing their networks and securing them.


Author: Sinclair Koelemij

OTcybersecurity web site

Dare for More, featuring the ICS kill-chain and a steel mill


When selecting a topic for a blog I generally pick one that entails some controversy. This time I select a topic that is generally accepted and attempt to challenge it to create the controversy. I believe very much that OT security is about learning, and that learning requires to continuously challenging the new knowledge we acquire. So this blog is not about trying to know better, or trying to refute a well founded theorem, but simply by applying some knowledge and ratio to investigate the feasibility of other options. In this case, is a one stage ICS attack feasible?

Five years ago Michael Assante and Robert Lee wrote an excellent paper called “The Industrial Control System Cyber Kill Chain“. I think the readers of this blog should carefully study this document, the paper provides a very good structure on how threat actors approach attacks on industrial control systems (ICS). The core message of the paper is that attacks on ICS, with the objective to damage production equipment, are two stage attacks.

The authors describe a first stage where the threat actor team collects information by penetrating the ICS and establishing a persistent connection, this is called in the paper the “Management and Enablement Phase“. This phase is followed by the “Sustainment, Entrenchment, Development, and Execution” phase, the phase where the threat actor captures additional information and prepares for the attack on the industrial control system (ICS).

Both phases are part of the first attack stage. The information collected in stage 1 is used to prepare the second stage in the kill chain. The second stage conducts the attack on the process installation to cause a specific failure mode (“the damage of the production system”). Typically there is considerable time between the first stage and the second stage, time used for the development of the second stage.

I assume that the rational of the authors for suggesting two stages is that each plant is unique, and as such each ICS configuration is unique, so to damage the process installation we need to know its unique configuration in detail before we can strike.

Seems like fair reasoning and the history of ICS attacks supports the theorem of two stage attacks.

  • Stuxnet required the threat actor team to collect information on: which variable speed drives were used to cause the necessary speed variations causing the excessive wear in the centrifuge bearings. The threat actor team also needed information on which process tags were configured in the Siemens control system to hide these speed variations from the process operator, and the threat actors required a copy of the PLC program code so they could modify it to execute the speed variations. The form of Stuxnet’s stage 1 differs probably very much from the ICS kill chain stage 1 scenario in general (Probably partially a non electronic old fashioned espionage activity), but this isn’t important. There is a stage 1 collecting information, and a stage 2 that “finishes” the job. So high level it matches the ICS kill chain pattern described in the paper.
  • The two attacks on the Ukraine power grid in 2015 and 2016 follow a similar pattern. It is very clear from the efficiency of the attack, developed tools and the very specific actions carried out, that the threat actor team had detailed knowledge on what equipment was installed, and which process tags were related to the breaker switches. So also in this case the threat actor team executed a stage 1 collecting information, than based on this information the threat actor team plans the stage 2 attack, and in the stage 2 attack the actual objective is realized.
  • The third example TRISIS / TRITON, follows the same pattern. Apparently the objective of this attack was to modify the safety integrity function in a Tristation safety controller. Details here are incomplete when reading / listening to the various sources. An interesting story, though perhaps at times a bit too dramatic for those of us that regularly spend their days at chemical plants, is for example the Darknet diaries on the TRISIS attack. Featuring among others Robert Lee and my former colleague Marina Krotofil. Was the attack directed against a Fire & Gas Tristation, or was the emergency shutdown function the target? This is not very clear in the story, because of the very different set of consequences for the production process an important detail if it comes to understanding the objective of the attack. Never the less also in the TRISIS case we saw a clear two stage approach, again an attack in two stages. First attack collecting the process information and Tristation configuration and logic, and a second attack attempting to install the modified logic and initiate (or wait for) something to happen. In my TRISIS revisited blog I explained a possible scenario to cause considerable damage and showed for this to happen that we don’t need to have a simultaneous attack on the control system.

What am I challenging in this blog? For me the million dollar question is, can an attacker cause physical equipment damage in a one stage attack, or are ICS attacks by default two stage attacks? Is a one stage attack, where all knowledge required is readily available in the public space and known by a subject matter experts, possible? And if it is a possibility, what are the characteristics that make such a scenario possible?

Personally I believe it is possible and I might even have seen an example of such an attack that I will discuss in more detail. I believe that an attacker with some basic hands-on practice working with a controls system, can do it it in a single stage.

I am not looking for scenarios that cause a loss of production, like for example a ransomware attack would cause. This is too “easy”, I am looking for targets that when attacked in the first stage would suffer considerable physical damage.

I am looking into these scenarios always for better understanding how such an attack would work and what we can learn from it to prevent such a scenario or make at least make it more difficult. Therefore I like to follow the advice of the Chinese general Sun Tzu, to learn to know the opponent, as well as our own shortcomings.


Sun Tzu wrote over 2500 years ago, the following important lesson which is also true in OT security:

  • “If you know the enemy and you know yourself, you don’t have to fear the result of a hundred battles.”
  • “If you know yourself, but not the enemy, you will also be defeated for every victory achieved.”
  • “If you don’t know the enemy or yourself, you will succumb in every battle.”

So lets investigate some scenarios that can lead to physical damage. In order to damage process equipment we have to focus on consequences with failure modes belonging to the categories: Loss of Required Performance and Loss of Ability (See my earlier blogs for an explanation) This since only failure modes in those categories can cause physical damage in a one stage attack.

Loss of confidentiality is basically the outcome of the first stage in a two stage attack, access credentials intellectual property (e.g. design information), or information in general all might assist in preparing stage 2. But I am looking for a single stage attack so need to rely on knowledge available in the public domain without the need to collect it from the ICS, gain access into the ICS and cause the damage on the first entry.

From a functional aspect, the type of function to attack for causing direct physical damage would be: BPCS (Basic Process Control System), SIS (Safety Instrumented System), CCS (Compressor Control System), MCC (Motor Control Center), BMS (Boiler Management System), PMS (Power Management System), APC (Advanced Process Control), CPS (Condition Protection System), and IAMS (Instrument Asset Management System).

So plenty of choice for the threat actor team depending on the objective. It is not difficult for a threat actor to find out which systems are used at a specific site and which vendor provided these functions. This because if we know the product made, we know which functions are mandatory to have. If we know the the business a bit we can find many detailed success stories on the Internet, revealing a lot of interesting detail for the threat actor team. Additionally threat actors can have access to a similar system for testing their attack strategies, such as for example the TRISIS threat actor team had access to a Triconix safety system for its attack.

To actually make the damage happen we also need to consider the failure modes of the process equipment. Some process equipment would be more vulnerable than others. Interesting candidates would be:

  • Extruders such as used in the thermoplastic industry, an extruder melts raw plastic, adds additives to it and passes it through a die to get the final product. This is a sensitive process where too high heath would change the product structure or an uneven flow might cause product quality issues. But the worst condition is no flow, if no flow happens this would result in that the melted plastic would solidify within the extruder. If this would happen, considerable time is required to recover from this. But this is a failure mode that happens once in a while also under normal circumstances, so an annoyance but process operations knows how to handle this so hardly an interesting target for a cyber attack attempting to cause significant damage.
  • How about a kiln in a cement process? If a kiln doesn’t rotate, the construction would collapse under its own weight. So stopping a kiln could be a potential target, however it is not that complex to create a safeguard creating a manual override to bypass the automation system to keep the kiln rotating. So also not an interesting target to pursuit for this blog.
  • How about a chemical process where runaway reactions are a potential failure mode? A runaway reaction is a thermally unstable reaction that accelerates with rising temperature and can ultimately lead to explosions and fires. A relatively recent example of such an accident is the Shell Moerdijk accident in 2014. Causing a runaway reaction could certainly be a scenario because these can be induced relatively easy. The threat actor team wouldn’t need that much specific information to carry out the attack, they could perhaps stop the agitator in the reactor vessel, or stop a cooling process to trigger the runaway reaction. If the threat actor gained access to the control system, this action is not that complex to do if familiar with control systems. So for me a potential single stage attack target.
  • Another example that came to mind was the attack on the German steel mill in 2014. According to the BSI report the attacker(s) gained access into the office network through phishing emails, once the threat actor had access into the office network they worked their way into the control systems. How this happened is not documented, but could have been through some key logger software. Once the threat actor had access to the control system they caused what was called “an uncontrolled shutdown” by shutting down multiple control system components. This looks like a one stage attack, lets have a closer look.

LESSON 1: Never allow access from the office domain into the control domain without implementing TWO-FACTOR AUTHENTICATION. Not even for your own personnel. Not implementing two-factor implementation is denying the risk of phishing attacks and ignoring defense in depth. When doing so we are taking a considerable risk. See also my blog on remote access, RULE 3.


For the steel mill attack there are no details known on what happened other than that the threat actor according to the BSI report shuts down multiple control system components and causes massive damage. Just speculating from now on what might have happened but a possible scenario could have been shutting down shutting down the cooling system and shutting down BPCS controllers so the operator can’t respond that quickly. The cooling system is one of the most critical parts of a blast furnace. Because the BSI report mentions both “Anlagen” and “Steurungskomponenten” it might have been above suggestion, first shutting down the motors of the water pumps and than shutting down the controllers to prevent a quick restart of the pumps.

The picture on the left (Courtesy of HSE) shows a blast furnace. A blast furnace is charged at the top with iron ore, coke, sinter, and limestone. The charge materials gradually work their way down, reacting chemically and thermally on their path down. This process takes about 6-8 hours depending on the size of the furnace. The furnace is heated by injecting hot air (approx. 1200 C) mixed with pulverized coal, and sometimes methane gas through nozzles called Tuyeres in the context of a blast furnace.

This results in a furnace temperature of over 2000 C. To protect the blast furnace shell against these high temperatures it is critical to cool the refractory lining (See picture). This cooling is done by pumping water into the lining. Cooling systems are typically fully redundant having doubled all equipment.

There would be multiple electrical pump systems and turbine (steam) driven pump systems. If one system fails, the other would take immediately over. One being steam driven, the other being electrical driven. So all looks fine from a cooling system failure perspective. The problem is that when we consider OT cyber security we also have to consider malicious failures / forced shutdowns. In those cases redundancy doesn’t work multiple motors can be switched of, neither is it so that if a process valve fails to a closed or open position there might not be another valve doing the same or in opposite direction. Frequently we see in process safety HAZOP analysis that double failures are not taken into account, this is the field of the cyber security HAZOP translating the various failure modes of the ICS functions in how they can be used to cause process failures.

The question in above scenario is could the attacker shutdown both pumps, and would there be a manual restart of the cooling system possible. If this would fail, the lining would overheat very quickly. In the case of a Corus furnace in Port Talbot, the cooling system was designed to run simultaneously two pumps, each producing 45.000 litres per minute. So a flow equivalent to 90.000 1 liter water bottles per minute. If we would need a crowd of people to consume this amount of water per minute, we get a very sizable crowd. Just to give you an idea how much water this is. If the cool water flow was stopped, the heat in the lining would rise very quickly and as a result the refractory lining would be damaged through the huge thermal stress created.

For safety purposes there is generally also an emergency water tower which acts when the water pressure drops. This system supplies water through gravitational force, it might not have worked, or maybe insufficient capacity to prevent damage. Or perhaps the attacker also knew a way to stop this safety control.


Do we need a two-stage attack for above scenario?

I believe a threat actor with sufficient hands-on experience with a specific BPCS, can relatively quickly locate these critical pumps and could shut them down. With the same level of knowledge he can subsequently shutdown the controller if his authorizations would allow this. Typically engineer level access would be required, but I also encountered systems were process operators could shutdown a controller. How blast furnaces work and what the critical functions are, even which companies specialize in supplying these functions is all in the public domain. So perhaps a single stage attack is possible.

If above is a credible scenario on what might have happened in the case of the German steel mill, what can we learn from it and do to increase the resilience against this attack?

  • First, we should not allow any remote access (access from the corporate network is also remote access) without two-factor authentication if the user would have “write” possibilities in the ICS. The fact that an attacker could gain access into the corporate network and from there could get access into the control network and causing an uncontrolled shutdown is in my opinion a significant (and basic) security flaw.
  • Second, we should consider implementing dual control for critical functions in the process that have a steady state. For example a compressor providing instrument air, or in this case a cool water pump and its redundant partners that should be on as the normal state. Dual control would demand that two users approve the shutdown action before the control system executes the command, this would generally be users with a different authorization level. Such a control would further raise the bar for the threat actor.

LESSON 2: For critical automation functions that can cause significant damage when initiated, consider to either isolate them from the control system (hardwired connections) or implement DUAL CONTROL to not only depend on a single layer of protection – access control. Defense in depth should never be ignored for critical functions, WHEN CRITICAL DON’T RELY ON A SINGLE CONTROL, APPLY DEFENSE IN DEPTH!


Above two additional security controls would make the sketched scenario much more difficult, almost impossible to succeed. OT security is more than installing AV, patching and a firewall. To reduce risk we need to assess security from all points of view: the automation function and its vulnerabilities, our protection of these vulnerabilities, our situational awareness of what is happening, and what threats there are – which attack scenarios could happen.

IEC 62443 specifies the “dual control” requirement as an SL 4 requirement, I personally consider this as a flaw in the standard and believe it should already be a mandatory requirement for SL 3 because unauthorized access to critical process equipment is well within the capabilities of the “sponsored attacker” type of threat actor.

Having dual control as a requirement doesn’t mean that all control actions should have this implemented, but there are critical functions in a plant that are seldom switched on or off where adding dual control adds security by adding DEFENSE IN DEPTH. When critical, don’t rely on a single control.


Also today’s blog is a story on the need for approaching OT security of ICS in a different manner as we do for IT systems where network security and hardening are the core activities for prevention. Network security and hardening of the computer systems are also essential first steps for an OT system but we should never forget the actual automation functions of the OT systems.

This is why OT security teams should approach OT security differently and construct bow-tie diagrams for cyber security hazards, relating cause (threat actor initiating threat action exploiting a vulnerability) to consequence (the functional deviation) and identifying security countermeasures, safeguards, and barriers. Only following this path we can analyze possible process failures as result of a functional deviation and can design OT systems in a secure way. However for this method to provide the required information we need a far higher level of detail / discrimination than terminology used in the past offered. Terminology such as loss of view and loss of control don’t lead to identifying countermeasures, safeguards and barriers. To make a step toward how a cyber attack can impact a production system we need much more granularity, therefor the 16 failure modes discussed in a prior blog.

Each ICS main function (BPCS, SIS, CCS, PMS, ….) has a fixed set of functions and potential deviations, it is the core task of the cyber security HAZOP to identify what risk they bring. Not to identify these deviations, these are fixed because each main function has a set of automation tasks it carries out. It are the deviations, their likelihood and severity for the production installation that are of importance, because than we know what benefits controls bring and which controls are of less importance. But we need to consider all options before we can select.


LESSON 3 – My final lesson of the day, first analyze what the problem is prior to trying to solve it.

Many times I see asset owners surfing the waves of the latest security hype. Every security solution has its benefits and “exciting” features, but this doesn’t mean it is the right solution for your specific problem or addressing your biggest security gap.

To know what are the right solutions you need to have a clear view on the cyber security hazards in your system, and then priority and select those that contribute most. There are often many features already available, start using them.

This leads to reusing methodologies we have learned to apply successfully for almost 60 years now in process safety, we should adapt them where necessary and reuse them for OT security.


There is no relationship between my opinions and references to publications in this blog and the views of my employer in whatever capacity. This blog is written based on my personal opinion and knowledge build up over 42 years of work in this industry. Approximately half of the time working in engineering these automation systems, and half of the time implementing their networks and securing them.


Author: Sinclair Koelemij

OTcybersecurity web site

Letting a goat into the garden


Criticizing a standard is no easy matter, once a group moves with a common idea the individual is supposed to stay in line. But the Dutch are direct, some might call it blunt, others rude. And I am Dutch and have a strong feeling the IEC 62443 standard is promising more than it can deliver, so want to address this in today’s blog. Not to question the value of the standard, neither to criticize the people contributing to it often in their private time, just to clarify where the standard has great value and where flaws are appearing.

This is a story about risk, and since the many wonders of OT security risk have my special attention, it is time to clarify my position on the standard in more detail.

The Dutch have a phrase “De knuppel in het hoenderhok gooien”, literally translated it means “Throwing the bat into the chicken shed”. The proper English translation seems to be to “Throw the cat among the pigeons”. Both expressions don’t align very well with my nature, agility and the purpose of this blog. So I was looking for a better phrase and decided to use the Russian phrase “пустить козла в огород” (let a goat into the garden). It seems to be a friendly action from the perspective of both the goat and the threat actor, so let me be the guy that lets the goat into the garden.

As always I like to learn, better understand the rational behind choices made, I don’t write this blog to confront those waiting in their trenches to fight for an unshakable belief in the blessings of a particular standard. Standards have strong points and weaker points.

I am in favor of standards, not too many standards if they merely overlap others, and I see their value when we make our initial steps to guide us in protecting our ICS targets.

I also see their value for vendors when they need to show asset owners that their products have been evaluated for meeting an established set of security requirements, to show that their development teams create new products with security processes embedded in their product development process, and to show that we operate our services with a focus on security. The ISA 99 team has really achieved a fantastic result and contributed to a more secure ICS. ISASecure is an excellent example of this.

But I also see that standards are sometimes misused by people to hide behind, for example if a standard doesn’t address a specific topic. “If the standard doesn’t address it, it isn’t important we can ignore it”. I see that standards are sometimes referred to in procurement documents to demand a certain level of protection. However standards are not written as procurement documents, they allow for many shades of gray and above all their development and refresh cycle struggles with the speed of change of technology in an continuously changing ICS threat landscape. Standards are good, but also have their pitfalls to be aware off. So I remain critical when I apply them.

Europe is a patchwork of standards without many major differences between those standards. Standards seem to bring out the dog in us, by developing new standards without substantially differentiating from existing. Standards sometimes seem to function as the next tree on a dogs walk through life. It is apparently a pleasant activity to develop new standards, though they often developed more into trust zones to make them look different creating hurdles in a global community.

The IEC 62443 / ISA 99 was the first standard that guided us (I know ISO 27001 has older roots, but not aimed at ICS). The standard had a significant influence in our thinking, also on my thinking, vocabulary and became the foundation for many standards since. Thanks to the standard we could make big steps forward.

But I feel the standard also makes promises it can’t meet in my opinion. Specifically the promise that it also addresses the threat posed by advanced threat actors with all the resources they need and operating in multi-discipline teams. The security level 3 and security level 4 type of threat actors of IEC 62443. This aspect I like to address in the blog.


IEC 62443-3-2 was recently released. The key concept of IEC 62443 turns around the definition of security zones and conduits between zones that pass the traffic, the conceptual pipeline that passes the channels (protocols) flowing between assets in the zones.

The standard wants us to determine “zone risk” and uses this risk to assign target security levels to a zone. A similar approach is also used by ANSSI the French standards institute, their standard also includes the risk model on how to estimate the risk.

Such an approach is the logical consequence from a drive to create a list of security requirements and provide a mechanism to select which of the many security requirements are an absolute must to stop a specific threat actor. “Give me a list on what to do” is a very human reaction when we are in a hurry and are happy with what our neighbors do to address a problem. However such an approach does not always take into account that the neighbor might be wrestling with a different problem.

ANSSI doesn’t link their risk result to a threat actor, IEC 62443 does link it to a threat actor in its SL1, SL2, SL 3, and SL4 definitions. ANSSI introduces the threat actor into its risk formula, taking a more capable threat actor into account raises the risk. The risk value determines the security class for the zone and the standard specifies which requirements must be met by the zone.

Within IEC 62443-3-2, the target level is the result of a high level risk assessment and a conversion from risk to a target security level. The IEC 62443-3-3 specifies the security requirements for this target level. Small differences between the two standards not important for my argument, though from a risk analysis perspective the ANSSI method is the theoretical better approach. It doesn’t need the transformation from risk to target level.


Where do I see a flaw in both ANSSI as well as IEC 62443 when addressing cyber security for critical infrastructure. This has to do with the concept of zone risk. Zone risk is in the IEC 62443 a kind of neighborhood risk, the assets live in a good or worse neighborhood. If you happen to live in the bad neighborhood you have to double your door locks, add iron bars before you windows and to also account for situational awareness and incident response you have to buy a big dog.

However zone risk / neighborhood risk doesn’t take the individual asset or threat into account. The protection required for the vault of a bank differs in the neighborhood from the protection required by the grocery that also wants to invite some customers in to do some business. You might say, the bank shouldn’t be in the bad neighborhood but that doesn’t work in an ICS where automation functions often overlap multiple zones.

There are a lot of intrinsic trust relations between components in an ICS that can be misused if we don’t take them into account. That would make security zones either so big that we could account anymore for differences in other characteristics (for example an 24×7 attended environment or an unattended environment) or make the zones so small that we get into trouble protecting the zone perimeter. The ideal solution would be what cyber security experts call the zero-trust-model, each asset is its own zone. This would be an excellent solution, but I don’t see it happen the gap with today’s ICS solutions is just too big, and also here there remain differences that require larger security zones.

Zone risk automatically leads to control based risk, a model where we compare a list with “what-is-good-for-you” controls with a list of implemented controls. The gap between the two lists can be seen as exposing non-protected vulnerabilities that can be exploited. The likelihood that this happens and the consequence severity would result into risk.

Essential for a control based risk model is that we ignore the asset and also don’t consider all threats, just those threats that result from the gap in controls. The concept works when you make your initial steps in life and learn to walk, but when attempting the steeple chase you are flat on your face very soon.

Zone risk is of course ideal for governance because we can make “universal rules”, it is frequently our first reaction to control risk.

The Covid-19 approach in many countries shows the difficulties this model faces. The world has been divided in different zones, sometimes countries, sometimes regions within a country. Governance within that zone has set rules for these regions, and thanks to this we managed to control the attack. So what is the problem?

Now we are on our way back to the “normal” society, while the threat hasn’t disappeared and is still present, we see the cracks in the rule sets. We have to maintain 1.5 meter distance (though rules differ by zone, we have 1 meter zones, and 2 meter zones). We allow planes to fly with all seats occupied, at the same time we deny this for buses and trains. We have restrictions in restaurants, theaters, sport schools, etc.

I am not challenging the many different rules, but just want to indicate that the “asset” perspective differs from the zone perspective and there are times that the zone perspective is very effective to address the initial attack but has issues when we want to continue with our normal lives. Governance today has a difficult job to justify all the differences, while trying to hold on their successful zone concept.

The same I see for OT security, to address our initial security worries the zone approach adopted by IEC 62443 worked fine. The defense team of the asset owners and vendors made good progress and raised the bar for the threat actor team. But the threat actor team also matured and extended their portfolio of devious attack scenarios, and now cracks become apparent in our defense. To repair these cracks I believe we should step up from control based risk to other methods of risk assessment.


The next step on the ladder is asset based risk. In asset based risk we take the asset and conduct threat modeling to identify which threats exist and how we best address them. This results in a list of controls to address the risk. We can compare this list with the controls that are actually implemented and the gap between the two will bring us on the path of estimating risk. Assets in this model are not necessarily physical system components, the better approach is to define assets as ICS functions. But the core of the method is we take the asset/function, analyse what can go wrong and define the required controls to prevent this from happening.

The big problem for governance is that this approach doesn’t lead to a confined set of controls or security requirements. New insights caused by changes in the function or environment of the function may lead to new requirements. But it is an approach that tends to follow technical change. For example the first version of IEC 62443-3-3 ignored the new technologies such as wireless sensors, virtual systems, and IIoT. This technology didn’t exist at the time, but today’s official version is still the version from September 2011. It took approximately 5 years to develop IEC 62443-3-3 and I believe it is an ISA policy to refresh a standard each 5 year. This is a long time in the security world. Ten years ago we had the Stuxnet attack, a lot has happened since than.

In threat based risk we approach it from the threat side, what kind of threats are feasible, what would be the best target for the threat actor team to execute the threat. If we have listed our threats, we can can analyze which controls would be necessary to prevent and detect them if attempted. These controls we can compare with the controls we actually applied in the ICS, and can construct risk from this gap to rank the threats in order of importance.

Following this approach, we truly follow the advice of the Chinese general Sun Tzu when he wrote “If you know the enemy and you know yourself, you don’t have to fear the result of a hundred battles. (Threat based risk) If you know yourself, but not the enemy, you will also be defeated for every victory achieved (Asset based risk). If you don’t know the enemy or yourself, you will succumb in every battle. (Control based risk)” Control based risk neither takes the asset into account (knowing yourself), nor the threat (knowing your enemy).


I don’t know if I have to call the previous part of the blog a lengthy intro, a historical context, or part of my continued story on OT cyber security risk. In the remainder of the blog I like to explain the concept of risk for operational technology, the core of every process automation system, meant to be the core of this blog.

When we talk about risk we make it sound as if only one type of risk exists, we sometimes mix up criticality and risk, and we use terms as high level risk where initial risk better represents what actually is attempted.

Let me try to be more specific starting with a picture I made for this blog. (Don’t worry the next diagrams are bigger).

The risk model

For me there are three types of risk related to ICS:

  • Cyber security risk
  • Process risk
  • Mission (or business) risk

Ultimately for an asset owner and its management, there is only one risk they are interested in, this is what I call mission risk. It is the risk related to the impact expressed in monetary value, in safety consequence, environmental damage, company image, regulations, and service delivery. Risk that directly threatens the companies existence. See the diagram I shared showing some of the impact categories in my earlier blog on OT cyber security risk.

If we can translate the impact of a potential cyber security incident (a cyber security hazard) into a credible mission risk value we catch the attention of any plant manager. Their world is for a large part risk driven. Management struggles with requests such as “I need a better firewall” (better means generally more expensive) without understanding what this better does in terms of mission risk.

Above model (I will enlarge the diagram) shows risk as a two stage / two step process. Let me explain starting at stage 1.

Cyber security risk

Part of what follows I already discussed in my ode to multiple honor and glory for Consequence, but I repeat it here partially for clarity and to add some more detail readers requested for in private messages.

The formula for cyber security risk is simple,

Cyber security risk = Threats x Vulnerability x Consequence.

I use the word consequence here, because I reserve the word impact for mission risk.

There is another subtle difference I like to make, I consider IT cyber security risk as a risk where consequence is primarily influenced by data. We are worried that data confidentiality is lost, data integrity is affected, or data is no longer available. The well known CIA triad.

Security in the context of automation adds another factor, that is the actions of the automated function. The sequence of actions certainly becomes of importance, time starts playing a role, it is becoming a game of action and interaction. Another factor, a very dominant factor enters the game. Therefore consequence needs to be redefined, to do this we can group consequence into three “new” categories:

  • Loss of required performance (LRP) – Defined as “The functions, do not meet operational / design intent while in service”. Examples are program logic has changed, ranges were modified, valve travel rates were modified, calibrations are off, etc.
  • Loss of Ability (LoA) – Defined as “The function stopped providing its intended operation” Examples are loss of view, loss of control, loss of ability to communicate, loss of functional safety, etc.
  • Loss of confidentiality (LoC) – Defined as “Information or data in the system was exposed that should have been kept confidential.” Examples are loss of intellectual property, loss of access credential confidentiality, loss of privacy data, loss of production data.

The “new” is quoted because the first two categories are well known categories in asset integrity management used on a daily base in plants. The data part (LoC) is simple, very much alike the confidentiality as defined in IT risk estimates. But for getting a more discriminating level of risk we need to split it up in additional sub-categories, sub-categories I call failure modes. For confidentiality there are four failure modes:

  • Loss of intellectual property – Examples of this can be a specific recipe, a particular way of automating the production process that needs to remain secret;
  • Loss of production data confidentiality – This might be data that can reveal production cost / efficiency, the availability to deliver a service;
  • Loss of access credential confidentiality – This is data that would allow a threat actor to raise his/her access privileges for a specific function;
  • Loss of privacy data confidentiality – This type of data is not commonly found in ICS, but there are exceptions where privacy data and with this the GDPR regulations are very important.

Failure modes differ for each function, there are functions for which none of above failure modes play a role and there are functions for which all play a role. Now let’s go to the next two categories Loss of Required Performance and Loss of Ability. These two are very specific for process automation systems like ICS. Loss of required performance has 6 failure modes assigned, in random sequence:

  • Integrity Operating Window (IOW) deviations – This applies to functional deviations that allow that the automation functions comes outside its design limitations which could cause immediate physical damage. Examples are modifying a level measurement range, potentially allowing to overfill a tank, or modifying a temperature range potentially damaging the coils in an industrial furnace. IOW is very important in a plant, so many standards have been addressing them;
  • Control Performance (CP) deviations – This failure mode is directly linked to the control dynamics, so where in the previous category the attacker modified engineering data, in this failure mode the attacker modifies operator data. For example raising a flow, stopping a compressor, shutting down a steel mill furnace. There are many situations in a plant where this can lead to dangerous situations, examples are when filling a tank with a non-conductive fluids, there are conditions that a static electricity buildup can create a spark. If there would be an explosive vapor in this tank this can lead to major accidents with multiple casualties. Safety incidents have been reported where this happened accidentally. One way to prevent this is to restrict the flow used to fill the tank. If an attacker would have access to this flow control he might maliciously maximize it to cause such a spark and explosion;
  • Functional safety configuration / application deviations (FS) – If safety logic or configuration was affected by an attack many things can happen, in most cases bad things because the SIS primary task is to prevent bad things from happening. Loss of functional safety and tampering with the configuration / application is considered a single category. This because there is no such thing as a bit of safety, safety is an all or nothing failure mode;
  • Monitoring and diagnostic function deviations (MD) – ICS contains many monitoring and diagnostic functions, for example vibration monitoring functions, condition protection functions, corrosion monitoring, analyzers, gas chromatography, emission monitoring systems, visual monitoring functions such as cameras monitoring the flare, and many more. Impacting these functions can be just as bad, as an example if an attacker were to modify settings in an emission monitoring solution the measured values might be reported as higher than they actually are. If this would become publicly known this would cause a stream of negative publicity and impact the company public image. Modifying vibration monitoring settings might prevent the detection of mechanical wear leading to a larger physical damage than would be the case if detected in time;
  • Monitoring data or alarm integrity deviation (MDAI) – This type of failure mode causes that data is no longer accurately represented, or alarms don’t occur when they should (Either too early, too late, maybe too many overflowing a process operator). The ICS function does in all cases its job as designed, however it is fed with wrong data and as a consequence might act in the wrong manner or too early or too late;
  • Loss of deterministic / real-time behavior behavior (RB) – This type of failure mode is very specific for real-time OT components. As I explained in my blog on real-time systems tasks are required to finish in time. if a task is not ready when its time slot ended it is bad luck, next time the task starts it starts at the beginning creating the possibility of starvation, where specific tasks never complete.

All above six failure modes have in common that the ICS functions, only it doesn’t function as intended. Either the design has been tampered with or its operational response doesn’t do the job as intended.

The next main category of consequences is Loss of Ability to perform, in this category the function is no longer available. But also here we have multiple failure modes (6) for grouping consequences.

  • Loss of controllability and / or intervention (LoCI) – When this occurs we lost the ability to move a system what is called its configuration space. We can’t adjust the flow anymore, pressure controls are lost, this might occur because the actuators fail, or because an operator has no longer access to the functions that allow him to do so.
  • Loss of observability (LoO) – This is the situation when we no longer can observe the actual physical state of the production process. This can be because we no longer measure this, but can also occur when we freeze the measured data by for example continuously replaying the same measurement message over and over again.
  • Loss of alarm or alerting function (LoAA) – This is the situation where there are no alarms or alerts warning the process operators of anomalies that they should respond to. Not necessarily restricted to BPCS alarms, it can also be alarms on a fire and alarm panel or a PAGA that doesn’t function.
  • Loss of coordination and / or collaboration (LoCC) – In an automation system, many functions collaborate or coordinate functions together. Coordination / collaboration is much more than communication, the activities need to be “synchronized” need to be aware of what the other is doing or things might go wrong with a potential high impact.
  • Loss of data communication (LoDC) – When we can’t communicate we can’t exchange commands or data. This doesn’t necessarily mean we can’t do anything, many functions can act isolated, sometimes there are hardwired connections to act.
  • Loss of reporting functions (historical data / trending) – This failure mode prevents us to report on ICS performance or observe slowly changing trends (creep) by blocking trending capabilities. Loss of reporting can be serious under certain circumstances, specifically for FDA and regulatory compliance.

This were the sixteen failure modes / sub-categories we can use to group consequences, functional deviations caused by a cyber attack. Not every function has all failure modes, and the failure modes have different severity scores for each function. But in general we can group hundreds of functional deviations of an ICS with its many functions (BPCS, SIS, CCS, IAMS, CDP, DAHS, PMS, MCC, MMS, ….) into these 16 failure modes and assign a severity value to each which we use for estimating cyber security risk for the various cyber security hazards.

I will not discuss all blocks of the diagram, that would be a book and no blog, but the criticality block is of importance. Why is criticality (the importance of the function) important?

For OT security criticality is a twin, one is criticality as the importance for the plant’s mission and the other is the importance for the threat actor. They are different things, for example a function such as Instrument Asset Management System (IAMS), is for the plant’s mission not so important, but for the threat actor’s mission it might be a very interesting object because it provides access to all field equipment.

The same differences we see with various technical and security management functions that if used by a threat actor provide him / her with many benefits. If we want to compare cyber security risk from different functions we can not just base this on consequence severity, we need to take function criticality into account. Another important aspect of criticality is that it is not a constant, criticality can increase over time. This provides us with information for our recovery time objectives, recovery point objectives, and maximum tolerable downtime. All critical security design parameters!

The zone and conduit model plays an important role in the Threat x Vulnerability, the likelihood, side of the cyber security risk equation. A very important factor here is exposure, which has two parts: dynamic exposure and static exposure. Connectivity is one of the three parameters for “measuring” static exposure.

The final block of the stage 1 side I like to discuss briefly, perhaps in a later blog in more detail, are the Functional Indicators of Compromise (FIoC).

In cyber security we are used to talk about IoC, general in the form that the threat actor makes some modifications in the registry or transfers some executable into a specific location. The research companies evaluating the cyber attacks, document these IoC in their reports.

But when we discuss functional deviations such as in OT cyber security as result of a cyber attack we have Indicators of Compromise here too, FIoC. This because often data is stored in multiple locations in the system. For example when we configure a controller we set various parameters for the field equipment connected. This data can be downloaded to the field equipment or separately managed by an IAMS. But it is not necessarily so that if changed in one place the other places are tracking it and automatically update.

This offers us one way of detecting inconsistencies and alert upon them. For multiple reasons an important function, but not always done. Similarly many settings in an ICS are always within a certain range, if they vary it are small variations. A cyber attack generally initiates bigger changes we can identify.

Not for all, but for many consequences / failure modes there is a functional indicator of compromise (FIoC) available to warn that something unusual occurred and we should check it.

Process risk and mission risk

Let’s slowly move to the end of the blog, I already surpassed my reading time long ago, let’s look at stage 2 the path from cyber security risk to mission risk.

Stage 1 provided us two results, a likelihood score and a set of functional deviations, that we need to bring over to stage 2. The identified functional deviations can cause deviations in the production process, perhaps a too high flow in my tank example, perhaps the possibility to close one or more valves simultaneously.

In order to evaluate their consequence for process risk we need to inspect which functional deviations have unforeseen potential process deviations. Process safety analysis thoroughly goes over the various failure modes that can occur in a plant and analyses how to prevent these to cause a personal safety incident or damage to the equipment.

But what process safety analysis does not do is looking for foul play. A PHA sheet might conclude that the failure of a specific valve is no issue because there is an open connection available, but what if that open connection would be blocked at the same time the threat actor manipulates initiates the failure of the valve. Two or more actions can occur simultaneously in an attack.

That is the activity in the second stage of the risk analysis, needed to arrive at mission risk. First we need to identify the process consequence that are of importance before we can translate this into business / mission impact. The likelihood of such an incident is the same as the likelihood of the cyber security incident that caused all the trouble.

Though the method of analyzing the process safety sheet and the checklist to process is probably just as interesting as many of the stage 1 processes a blog needs to end. So perhaps a later blog, or a book when I am retired.


What did I try to say in this blog? Well first of all I like to repeat, standards are important and the IEC 62443 is the most influential of all and contributes very much to the security of ICS. Doesn’t take away they are not above criticism, it is after all a men made product.

The structure of standards such as IEC 62443 or the French ANSSI standard leads to control based risk because of their zone based strategy. Nothing wrong with this, but in my opinion not sufficient to protect more critical systems that are attacked by more capable threat actors. Like the SL 3 and SL 4 type of threat actors. There I see gaps in the method.

I explained we have three forms of risk, cyber security risk, process risk, and mission risk. They differ because they need different inputs. We cannot just jump from cyber security risk to mission risk forgetting about how the functional deviations in the ICS caused by the cyber attack impact the production process, we need to analyse this step.

I have shown and discussed a two stage method to come from a cyber security hazard to a process failure hazard to mission risk. I didn’t explain the method on how I identified all these cyber security hazards, nor the method of risk analysis analysis to estimate likelihood. This can still be either threat based or asset based, maybe another blog to explain the details.

But at minimum the asset specific elements and the threats are accounted for in the method described, this is missing in the zone risk approach. Functional deviations (consequences) play no role in zone risk estimates.

Does this mean the IEC 62443 isn’t good enough, no absolutely not. All I say in this blog it is not complete enough, security cannot be achieved with just a list of requirements. This plays no role when the objective is to keep the cyber criminals (SL 2) out, it plays a role when attacks become targeted and ICS specific. It is my opinion that for SL 3 and SL 4 we need a detailed asset or threat based risk analysis that potentially adds new requirements (and in my hands-on experience it does) to the requirements identified by the zone risk analysis.


So what would I like to see different?

  • IEC 62443 starts with an inventory, this seems for me the right first step.
  • Then IEC 62443 starts with a high level risk assessment, this I believe is wrong. Apart from the name (should have been initial risk assessment) I think there is no information available to determine likelihood, so it becomes primarily an impact driven assessment. Than the proper choice in my opinion would have been to conduct a criticality assessment, for criticality I don’t need likelihood. Apart from this, criticality in a plant has a time aspect because of upstream / down stream dependencies. This provides us with recovery time objectives (for the function), recovery point objectives, and maximum tolerable downtime when multiple functions are impacted. This part is missing in the IEC 62443 standard, while an important design parameter. Another reason is of course that when we do asset based or threat based risk and start comparing risk between multiple functions we need to take the function’s criticality into account.
  • Then IEC 62443 creates a zone and conduit diagram, no objections here. To determine risk we need static exposure, we need to know which assets go where. So good step.
  • Then IEC 62443 does a detailed risk assessment, also the right moment to do so. Hopefully also in IEC 62443 will see the importance of asset or threat based risk assessment. The standard doesn’t discuss this, it might as well be a control based risk assessment. But because there is no criticality assessment I concluded it must be a control based assessment not looking at risk at function level.

I hope I didn’t step on too many toes, only wanted to give a goat a great day. It is just my opinion as private person working as a consultant during business hours. Who on a daily base, during working hours, needs to secure systems, many of them part of national critical infrastructure.

Above is what I am missing, a criticality assessment, and a risk assessment that meets the SL3 / SL4 threat.


There is no relationship between my opinions and publications in this blog and the views of my employer in whatever capacity. this blog is written based on my personal opinion and knowledge build up over 42 years of work in this industry. Approximately half of the time working in engineering these automation systems, and half of the time implementing their networks and securing them.


Author: Sinclair Koelemij

OTcybersecurity web site

The Classic ICS perimeter


Whenever I think about an ICS perimeter, I see the picture of a well head with its many access controls and monitoring functions. In this mid-week blog, I have chosen an easy digestible subject. No risk and certainly no transformers this time, but something I call the “Classic ICS perimeter”.

What is classic about this perimeter? The classic element is that I don’t discuss all those solutions that contribute to the “de-perimeterization” – if this is a proper English word – of the Industrial Control Systems (ICS) when we implement wireless sensor networks, virtualization, or IIoT solutions.


There are many different ICS perimeter architectures, some architectures just exist to split management responsibilities and some architectures add or attempt to add additional security. I will discuss in this blog that DCS and SCADA are really two different systems, with different architectures, but also different security requirements.

When I started to make the drawings for this blog, I quickly ended up with 16 different architectures, some bad some good, but all exist but my memory might have failed too. The focus in the blog is on the perimeter between the office domain(OD) and the process automation network (PAN). I will briefly detail the PAN into its level 1, level 2, and level 3 segments, see also my blog on the Purdue Reference Model. Internal perimeters between level 2 and level 3 are not discussed in this blog because of the differences that exist between different vendor solutions for level 1 and level 2 or interfacing with legacy systems.

Different vendors often differ in level 2 / level 1 architecture, different implementation rules to follow to meet vendor requirements and different network equipment. To cover these differences would almost be a second blog. So this time a bit more a focus on IT technology than my normal focus on OT cyber security. More the data driven IT security world than the data plus automation action driven OT cyber security world.


Maybe the first question is, why do we have a perimeter? Can’t we just air-gap the ICS?

We generally have a perimeter because data needs to be exchanged between the planning processes in the office domain and the operations management / product management functions in the PAN (see also my PRM blog) and sometimes engineers want remote access into the network (see the remote access blog). When the tanker leaves Kuwait, the composition data of the crude is available and the asset owner will start its planning process. Which refinery can best process the crude, what is the sulfur level in the crude, and many more. Ultimately when the crude arrives, and is stored into tanks in the terminal, and forwarded to the refinery to produce the end product, this data is required to set some of the parameters in the automation system. Additionally production data is required by the management and marketing departments, custody metering systems produce records on how much crude has been imported, environmental monitoring systems collect information from the stacks and water surface to report that no environmental regulations are violated.

Only for very critical systems, such as for example nuclear power, I have seen fully isolated systems. Not only are the control systems isolated, but also the functional safety systems remain isolated. Though also in this world more functions become digital, and more functions are interfaced with the environment.

More common is the use of data diodes as perimeter device in cases where one way traffic (from PAN to OD) suffices. And also in this world we see compromises by allowing periodic reversal of the data flow direction to update antivirus systems and security patches. But by far, most systems have a perimeter based on a firewall connection between the OD and the PAN, the topic of this blog.

I start the discussion with three simple architecture examples.

Some basic perimeters, frequently used

Architecture 1, a direct connection between the OD and the PAN.

If the connection is exclusively an outbound connection, this can be a secure solution for less critical sites. Though any form of defense in depth is missing here, if the firewall gets compromised the attacker gets full access to the PAN. A firewall / IPS combination would be preferred. Still some asset owners allow this architecture to pass outbound history information in the direction of the office domain.

Architecture 2, adding a demilitarized zone (DMZ).

A DMZ is added to allow the inspection of the data before the data continuous on its path to functions in the PAN. But if we do this we need to actually inspect this data, just forwarding it using the same protocols adds a little security (hiding the internal network addresses of the PAN) but only if we use a different range and not just continue with private IP address ranges like the 10.10 or 192.168 range.

Alternatively the PAN can make data available for the office domain users by offering an interface to this data in the DMZ. For example a web service providing access to process data. But we better make sure it is a read only function, not allowing write actions to the control functions.

The theoretically ideal DMZ only allows inbound traffic. For example a function in the PAN sends data to a DMZ function, and a user or server in the OD collects this data from the DMZ. Or in the reverse direction. Unfortunately not all solutions offer this possibility, in those cases inbound data from the OD needs to continue toward a PAN function. In this situation we should make certain that we use different protocols for the traffic coming in the DMZ and the traffic going from the DMZ to the PAN function. (Disjoint protocols)

The reason for the dis-joint protocol rule is to prevent that a vulnerable service can be used by a network worm to jump from the OD into the PAN. Typical protocols where this can happen are RDP (Microsoft terminal server), SMB (e.g. file shares or print servers), RPC (e.g. RPC DCOM used by classic OPC), and https (used for data exchange).

If the use of disjoint protocols is not available, an IPS function in the firewall becomes very important. The IPS function can intercept the network worm attempting to propagate through the firewall by inspecting the traffic for exploit patterns.

Another important consideration in architectures like this is how to handle the time synchronization of the functions in the DMZ. The time server protocol (e.g. NTP) can be used for amplification attacks in an attempt to create a denial of service of a specific function. An amplification attack happens when a small message triggers a large response message, if we combine this with spoofing the source address of the sender we can use this for attacking a function within the PAN and potentially overloading it. To protect against this, some firewalls offer a local time server function. In this case the firewall synchronizes with the time server in the PAN and offers a separate service in the DMZ for time synchronization. So there is no inbound (DMZ to PAN) NTP traffic required, preventing the denial of service amplification attack from the DMZ toward a PAN function.

Architecture 3, adding an additional firewall.

Adding an additional firewall prevents that if the outer firewall is compromised, the attacker has direct access into the PAN. With two firewalls, breaching the first firewall gives access to the DMZ, but a second firewall is there to stop / delay the attacker. This moment needs to be used to detect the first breach by monitoring the traffic and functions in the DMZ for irregular behavior.

This delay / stop works best if the second firewall is of a different vendor / model. If both would be from the same vendor, using the same operating software, the exploit causing the breach on the first firewall would most likely also work for the second. Having two different vendors delays the attacker more and increases the chance on detecting the attacker trying to breach the second firewall. DMZs create a very strong defense if properly implemented. If this is not possible we should look for compensating controls, but never forget that defense in depth is a key security principle. It is in general not wise to rely on just one security control to stop the attacker. And please don’t think that the PRM segmentation is defense in depth enough, there are very important operations management functions at level 3 that are authorized to perform critical actions in the production management systems at level 2 and level 1. Know your ICS functions, understand what they do and how they can fail. It is an essential element in OT cyber security it is not just controlling network traffic.


A variation on architecture 2 and 3 is shown in the next diagram. Here we see for architecture 4 and architecture 5 two firewalls in series (Orange and red). This architecture is generally chosen if there are two organizations responsible for the perimeter. For example the IT department and the plant maintenance department, each protecting their realm. Though the access rules for the inbound traffic are the same for both firewalls in architecture 4 and 5, this architecture can offer a little bit more resilience than architecture 2 / 3 because of the diversity added if we use two different firewalls.


Architecture 6, adds a second internal boundary between level 3 functions (operations management) and level 2 / level 1 functions (production management).

For the architectures 1 to 5 this might have been implemented with a router between level 3 and level 2 in combination with access control lists. Firewalls can offer more functionality, especially Next Generation Firewalls (NGFW – strange marketing invention that seems to hold for all new firewall generations to come) offer the possibility to limit access based on user and specific applications or proxies allowing for a more granular control over the access into the real-time environment of the production management functions.


Sometimes plants require Internet access for perhaps specialized health monitoring systems of the turbine or generator, or maybe remote access to a support organization. Preferably this is done by creating a secure path through the office domain toward the Internet, but it happens that the IT department doesn’t allow for this or there is no office domain to connect to. In those cases asset owners are looking for solutions using an Internet provider, or a 4G solution.

Architectures with local Internet connectivity

Architecture 7 shows the less secure option to do this if the DMZ also hosts other functions. In that case architecture 8, with a separate DMZ for the Internet connection, is preferred because the remote connectivity is kept separate from any function in DMZ 1. This allows for more restricted access filters on the path toward the PAN and reduces the risk for the functions in DMZ 1. The potential risk with architecture 7 is that the firewall that connects to the Internet is breached and gets access to the functions in the DMZ, potentially breaching these and as a next step gaining access to the PAN. We should never immediately expose the firewall with the OD perimeter to the Internet, also here two different firewalls improve security preferably only allowing end to end protected and encrypted connections.

The final 4 DCS architectures I discuss briefly are more as example for an alternative approach.

Some alternative DCS perimeters

Architecture 9, is very similar to architecture 6 without the DMZ. The MES layer (Manufacturing Execution Systems) hosts the operation management systems. This type architecture is often seen in organizations where the operation management systems are managed by the IT department.

This type of architecture also occurs when there are different disciplines “owning” the system responsibility, for example a team for the mechanical maintenance “owning” a vibration monitoring function, another team “owning” a power management function and the motor control center functions, and maybe a 3rd group “owning” the laboratory management functions.

In this case there are multiple systems, each with its own connection to the corporate network. In general splitting up the responsibility for security often creates inconsistencies in architecture and security operations and as such a higher residual risk for the investment made. Sometimes putting all your eggs into one basket is better, when we focus our attention on this single basket.

Architecture 10 is the same as architecture 9 but now with a DMZ allowing additional inspections. Architecture 11 is an architecture frequently used in larger sites with multiple plants connected to a common level 3 network. There is a single access domain that controls all data exchange with the office domain, hosts various management functions such as back-up, management of the antivirus systems, security patch management, and remote access.

There are some common operations management functions at L3 and each plant has its own production management system connected through a firewall.

Architecture 12 is similar but the firewall is replaced by a router filtering access to the L2/L1 equipment. In smaller system this can offer similar security, but like discussed a firewall offers more functions to control access.

An important pit fall in many of these architectures, is the communication using classic OPC. Due to the publications of Eric Byres allmost 15 years ago, and the development of the OPC firewall there is a focus on the classic OPC protocol not being firewall friendly. This because of the wide dynamic port range required by RPC DCOM for the return traffic. Often the more important security issue is the read / write authorizations of the OPC server.

Several OPC server solutions enable read / write authorizations server wide, which results in also exposing control tags and their parameters not required for implementing the automation function required.

For example sometimes a vibration management system with write access to the control function to signal a shutdown of the compressor because of excessive vibrations, also permits this system to approach other process tags and their parameters. Filtering the traffic between the two systems in that case doesn’t provide much extra security if we have no control over the content of the traffic.

Implementation of OPC security gateway functionality offers more protection in those cases. Limiting which process tags can be browsed by the OPC client, which process tag / parameter can be written to and which can be read from.

Other improvements are related to OPC UA where solutions exist that support reverse connect, so the firewall doesn’t require inbound traffic if communication is required that crosses the perimeter.


So far high level some common ICS architectures when DCS is used for the BPCS (Basic Primary Control System) function, the variation in SCADA architectures is smaller, I discuss the 4 most common ones.

SCADA architecture

The first SCADAs were developed to centralize the control of multiple remote substations. In those days we had local control (generally with PLCs and RTUs. IEDs came in later times) in the substation and needed a central supervisory function to oversee the substations.

A SCADA architecture generally has a firewall connecting it with the corporate network and a firewall connecting it with the remote substations. This can be a few substations, but also hundreds of locations in the case of pipelines where block valves are controlled to segment the pipe in case of damaged pipelines. Architecture 13 is an example of such an architecture. The key characteristic here is that the substations have no firewalls. Architecture 13 might be applied in the case if the WAN is a private network dedicated for the task to connect to the substations / remote locations.

Substation architecture varies very much depending on the industry. A substation in the power grid has a different architecture, than a compressor substation for a pipeline, or a block valve station segmenting the pipeline, or a clustering of offshore platforms.

Architecture 14 is an architecture where we have a fall back control center. If one control center fails, the fall back center can take over the primary control center. Primary is perhaps a wrong word here, because some asset owners periodically swap between the two centers to verify its operation.

The two control centers require synchronization, this is done by the direct connection between the two. It depends very much on the distance between the two centers how synchronization takes place. Fall back control centers exist on different continents many thousands of miles distance.

Not shown in the diagram but often implemented is a redundant WAN. If the primary connection fails the secondary connection takes over. Sometimes a G4 network is used, sometimes an alternative WAN provider.

Also here diversity is an important control, implementing a fall back WAN using a different technology can offer more protection – a lower risk.

SCADA architecture

Architecture 15 is similar to architecture 13, with the difference of the firewall at the substations, this when the WAN connections are not private connections. The complexity here is the substation firewalls in combination with the redundancy of the WAN connections. Architecture 16 adds the fall back control center.


Blogs have to end, though there is much to explain. In some situations we need to connect both the BPCS function and the SIS function to a remote location. This creates new opportunities for an attacker if not correctly implemented.

A good OT cyber security engineer needs to think bad, consider which options an attacker has, what the attack objective can be. To understand this it is important to understand the functions because it are these functions and their configuration that can be misused in the plans of the threat actor. Think in functions, consider impact on data and impact on the automation actions. Network security is an important element, but with just looking at network security we will not secure an industrial control system.


There is no relationship between my opinions and publications in this blog and the views of my employer in whatever capacity. this blog is written based on my personal opinion and knowledge build up over 42 years of work in this industry. Approximately half of the time working in engineering these automation systems, and half of the time implementing their networks and securing them.


Author: Sinclair Koelemij

OTcybersecurity web site

Power transformers and Aurora


Almost 2 weeks ago, I was inspired by the Wall Street Journal web site and a blog from Joe Weiss to make a blog on a power transformer that was seized by the US government while on its way to its destination. “Are Power transformers Hackable”, the conclusion was yes they can be tampered with but it is very unlikely they are in the WAPA case.

Since than there were other discussions / posts, interviews, all in my opinion very speculative and in some cases even wrong. However there was also an excellent analysis report from Sans that provided a good analysis on the topic.

The report shows step by step that there is little ( more accurate there is no) evidence provided by the blogs and news media that China would have tampered with the power transformer in an attempt to attack the US power grid at a later moment in time.

That was also my conclusion, but the report provides much a more thorough and convincing series of arguments to reach this conclusion.

Something I hadn’t noticed at the time, and was added by Joe Weiss in one of his blogs, is the link to the Aurora attack. I have always been very skeptical on the Aurora attack scenario, not that I think it is not feasible, but because I think it will be stopped in time and is hard to properly execute. But the proposition of an Aurora attack in combination with tampering the power transformer is an unthinkable scenario for me.

Let’s step back to my previous blog, but add some more technical detail using the following sketch I made:

Drawing 1 – A hypothetical power transformer (with on load tap changer) control diagram

The diagram shows in the left bottom corner the power transformer with an on load tap changer to compensate for the fluctuations in the net.
Fluctuations that are quite normal now the contribution of renewable power generation sources such as solar and wind energy is increasing. To compensate for these fluctuations an automated tap changer continuously adapts the number of windings in the transformer. So it is not unlikely that the WAPA transformer would have an automated On Load Tap Changer (OLTC).

During an energized condition, which is always the case in an automated situation, this requires a make before break mechanism to step from one tap position to the next. This makes it a very special switching mechanism with various mechanical restrictions with regard to changing position, one of them is that a step is limited to a step toward an adjacent position. Because there is always a moment that both adjacent taps are connected it is necessary to restrict the current, so we need to add impedance to limit the current.

This transition impedance is created in the form of a resistor or reactor and consist of one or more units that are bridging adjacent taps for the purpose of transferring load from one tap to the other without interruption or an appreciable change in the load current. At the same time, they are limiting the circulating current for the period when both taps are used.

See the figure on the right for a schematic view of an OLTC. There is a low voltage and a high voltage side on the transformer. The on-load-tap-changer is at the high voltage side, the side with the most windings. In the diagram the tap changer is drawn with 18 steps, which is a typical value though I have seen designs that allowed as much as 36 steps. A step for this type tap changer might be 1.25% of the nominal voltage. Because we have three phases, we need to have three tap changers. The steps for each of the three phases need to be made simultaneously. Because of the make-before-break principle, the tap can only move one step at the time. It needs to pass all positions on its way to its final destination. When automated on-load-tap-changers are used the operating position needs to be shown in the control room.

For this each position has a transducer (not shown in the drawing) that provides a signal to indicate where the tap is connected. There is a motor drive unit moving the tap upward or downward, but always step by step. So the maximum change per step is approximate 1.25%. If a step change is required, is determined by the voltage regulator (See drawing 1), the voltage regulator measures the voltage (using an instrument transformer) and compares this with an operator set reference level. Based on the difference between reference level and measured level the tap is moved upward (decreasing the number of windings) or downward (increasing the number of windings).

To prevent that there will be jitter, caused by moving the tap upward and immediately downward, the engineer sets a delay time between the steps. A typical value is between 15 – 30 seconds.

Also if there is an operator that wants to manually jump from tap position 5 to tap position 10 (Manual Command mode), the software in the voltage regulator still controls this step by step by issuing consecutive raise/lower tap commands and on the motor drive side this is mechanically enforced by the construction. On the voltage regulator unit itself, the operator can only press a raise and lower button also limited to a single step.

The commands can be given from the local voltage regulator unit or from the HMI station in the substation or remotely from the SCADA in a central control center. But important for my conclusions later on, is to remember it is step by step … tap position by tap position … no athletics allowed or possible.


Now lets discuss the Aurora principle. The Aurora attack scenario is based on creating a repetitive variable load on the generator. For example disconnecting the generator from the grid and quickly connecting it again. The disconnection would cause the generator to suddenly increase its rotation speed because there is no load anymore, connecting the generator again to the grid would cause a sudden decrease in rotation speed. Taking the enormous mass of a generator into account, these speed changes result in a high mechanical stress on the shaft and bearings which would ultimately result into damage requiring to replace the generator. Which takes a long time because also generators are build specifically for a plant.

When we go from full load to no load and back this is a huge swing in mechanical forces released on the generator. This also because of the weight of the generator, you can’t stop it that easy. Additionally behind the generator we have the turbine creates the rotation by the steam from the boilers. So it is a relative easy mechanical calculation to understand that damage will occur when this happens. But this is when the load swings from full load to no load.


Using a tap changer to create an Aurora type of scenario doesn’t work. First of all even if we could have a maximum jump from the lowest tap to the highest tap (which is not the case because the tap would normally be somewhere around the mid-position, and it is mechanically impossible) it is a swing of 20-25% in load.

The load variations from a single step are approximately 1.25%, and the next step is only made after the time delay, in the Aurora scenario a reverse step of 1.25%. This is by no means sufficient to cause the kind of mechanical stress and damage that occurs after a swing from full load to zero load.

Additionally the turbine generator combination is protected by a condition monitoring function that detects various types of vibrations including mechanical vibrations of the shaft and bearings.

Since the transformer caused load swing is so small that it will not cause immediate mechanical issues, the condition monitoring equipment will either alert or shutdown the turbine generator combination when detecting anomalous vibrations. The choice between alert or shutdown is a process engineering choice. But in both cases the impact is quite different from the Aurora effect caused by manipulating breakers.

Repetitive tap changes are not good for generators, therefore the time delay was introduced to prevent any additional wear from happening. The small load changes will cause vibrations in the generator but these vibrations are detected by the condition monitoring system and this function will prevent damage if the vibrations are above the limit.

Than the argument can be, but the voltage regulator could have been tampered with. True, but voltage regulators are not coming from the same company that supplied the transformer. Same argument for the motor drive unit. And you don’t have to seize a transformer to check the voltage regulator, anyone can hand carry it.

And of course as the SANS report noted, the placement of the transformer needs to be right behind the turbine generator section. WAPA is a power distribution company, not a power generation company so not a likely situation too.

I read another scenario on Internet, a scenario based on the use of the sensors for the attack, therefore I added them to diagram 1. All the sensors in the picture check the condition of the transformer. If they would not accurately represent the values, this might lead to undetected transformer issues and a transformer failure over time. But it would be failure at a random point in time, inconvenient and costly but those things happen also if all sensors function. But manipulating them as part of a cyber attack to cause damage, I don’t think this is possible. At most the sensors could create a false positive or false negative alarm. So I don’t see a feasible attack scenario here that works for conducting an orchestrated attack on the power grid.

In general if we want to attack substation functions, there are a few options in diagram 1. The attack can come over the network, the SCADA is frequently connected to the corporate network or even to the Internet. Famous example is the Ukraine attack on the power distribution. We can try penetrating the WAN, these are not always private connections so there are opportunities here. So far never seen an example of this. And we can attack the time source, time is a very important element in the control of a power system. Though time manipulation this has been demonstrated, I haven’t seen it used against a power installation. But all these scenarios are not related to the delivery of a Chinese transformer and a reason for intercepting it.


So based on these technical arguments I don’t think the transformer can be manipulated in a way that causes an Aurora effect. Too many barriers are preventing this scenario. Nor do I think that tampering the sensors would actively enable an attacker to cause damage in a way where the attacker determines the moment of the attack. The various build-in (and independent) safety mechanism would also isolate the transformer before physical damage occurs.

For me it is reasonable hat the US government initiates this type of inspections, if a supply chain attack from a foreign entity is considered a serious possibility, than white listing vendors and inspecting the deliverable is a requirement for the process. If this is a great development for global commerce, I doubt very much. But I am an OT security professional, no economist, so this is just an opinion.

Enough written for a Saturday evening, I think this ends my blogs on power transformers.


There is no relationship between my opinions and publications in this blog and the views of my employer in whatever capacity.


Sinclair Koelemij

Consequence with capital C


In my previous blog I quickly touched upon the subject Consequence and the difference between Consequence and impact and its relationship with functionality. This blog focuses specifically on what Consequence is for OT cyber security risk.

I mentioned that a cyber attack in an OT system consist in its core elements out of:


A threat actor carrying out a threat action by exploiting a vulnerability resulting in a Consequence that causes an impact in the production process.


In reality this is of course a simplification, the threat actor normally has to carry out multiple threat actions to make progress in achieving the objective of the attack, this is explained by the cyber kill chain concept of Lockheed Martin. And of course the defense team will normally not behave like a sitting duck and starts to implement countermeasures to shield the potential vulnerabilities in the automation system and would build barriers and safeguards to limit the severity of specific Consequences. Or where possible remove the potential Consequence all together. Apart from these preventive controls the defense team would establish situational awareness in an attempt to catch the threat actor team as early as possible in the kill chain.

Sometimes it looks like there are simple recipes for both the threat actors and defenders of an industrial control system (ICS):

  • The threat actor team uses the existing functionality for its attack (something we call hacking), the defense team will counter this by reducing functionality available to the attacker (hardening);
  • The threat actor team adds new functionality to the existing system (we call this malware), the defense team will white list all executable code (application white listing);
  • The threat actor team adds new functionality to the existing system using new components (such as in the supply chain attack), the defense team requests for white listing the supply chain (e.g. the widely discussed US presidential order);
  • Because a wise defense team doesn’t trust the perfectness of its countermeasures and respects the threat actor team’s ingenuity and persistence, the defense team will add some situational awareness to the defense by sniffing around in event logs and traffic streams attempting to capture the threat actors red-handed.

Unfortunately there is no such thing as perfectness in cyber security or something like zero security risk. New vulnerabilities pop-up every day, countermeasures aren’t perfect and can even become an instrument for the attack (E.g. the Flame attack in 2012, creating a man-in-the-middle between the Windows Updates System distributing security patches and the systems of a bank in the Gulf Region). New tactics, techniques and procedures (TTP) are continuously developed, and new attack scenarios designed, the threat landscape is continuously changing.

To become more pro-active the OT cyber security defense teams adopted risk as the driver, cyber security risk being equivalent to the formula Cyber Security Risk = Threat x Vulnerability x Consequence.

Threats and vulnerabilities are addressed by implementing the traditional countermeasures. A world of continuous change and research for vulnerabilities, the world of network security.

In this world Consequence is often the forgotten variable to manage, an element far less dynamic than the world of threats and vulnerabilities. But offering a more effective and reliable risk reduction than the Threat x Vulnerability part of the formula. So this time the blog is written to honor this essential element for OT cyber security risk, our heroine of the day – Consequence.


Frequent readers of my blog know that I write long intros and tend to follow them up sketching the historic context of my subject. Same recipe in this blog.

When the industry was confronted with the cyber threat, after more and more asset owners changed over from automation systems based on proprietary technology toward systems build on open technology, a gap in skills became apparent.

The service departments of the vendor organizations and the maintenance departments of the asset owners were not prepared for dealing with the new threat of cyber attacks. In the world of proprietary systems they were protected by the lack of knowledge of the outside world of the internal workings of these systems, the connectivity between systems was less, and the number of functions available was smaller. And perhaps also because in those days it was far more clear who the adversaries were than it is today.

As a consequence asset owners and vendors were looking for IT schooled engineers to expand their capabilities and IT service providers attempted to extend their business scope. IT engineers had grown their expertise since the mid-nineties, they benefited from a learning curve over time to improve their techniques in preventing hacking and preventing infection with malicious code.

So initially the focus in OT security was on network security, a focus on the hardening (attack surface reduction / increasing resilience) of the open platforms, and network equipment. However essential security settings in the functionality of the ICS, the applications running on these platforms, were not addressed or didn’t exist yet.

Most of the time the engineers were not even aware these settings existed. These security settings were set during the installation, sometimes as default settings, and were never considered again if there were no system changes. Additionally the security engineers with a pure IT background had never configured these systems, they were not familiar with the functionality in these systems. If the Microsoft and network platforms were secure the system was secure.

OT cyber security became organized around network security, I (my personal opinion, certainly not my employer’s 🙂 – for those mixing up the personal opinion of a technical security guy and the vision of the employer he works for. ) compare it with the hypothalamus of the brain, the basic functions sex and a steady hart rhythm are implemented, but the wonders of the cerebral cortex are not yet activated. The security risk aspects of the automation system and process equipment were ignored, too difficult and not important because so far never required. This changed after the first attack on cyber physical systems, the Stuxnet attack in 2010.

Network security focuses on the Threat x Vulnerability part of the risk formula, the Consequence part is always linked to the functional aspects of the system. Functional aspects are within the domain of the risk world.

Consequence requires us to look at an ICS as a set of functions, where the cyber attack causes a malicious functional deviation (the Consequence) which ultimately results into impact on the physical part of the system. See my previous blog for an overview picture of some impact criteria.

What makes OT security different from IT security, is this functional part. An IT security guy doesn’t look that much at functionality, IT security is primarily data driven. An OT security guy might have some focus on data (some data is actual confidential) but his main worry is the automation function. The sequence and timing of production activities. OT cyber security needs to consider the Consequence of this functional deviation, they need to think about barriers / safeguards, or what ever name is used to reduce the overall Consequence severity in order to lower risk.

Therefore Sarah’s statement in last week’s post “Don’t look at the system but look at the function” is so relevant when looking at risk. For analyzing OT cyber security risk we need to activate the cerebral cortex part of our OT security brain. So far the historical context of hero in this blog. Let’s discuss Consequence en the functions of ICS in more technical detail.


For me, from an OT security perspective, there are three loss possibilities:

  • Loss of required performance (LRP) – Defined as “The functions, do not meet operational / design intent while in service”. Examples are program logic has changed, ranges were modified, valve travel rates were modified, calibrations are off, etc.
  • Loss of Ability (LoA) – Defined as “The function stopped providing its intended operation” Examples are loss of view, loss of control, loss of ability to communicate, loss of functional safety, etc.
  • Loss of confidentiality (LoC) – Defined as “Information or data in the system was exposed that should have been kept confidential.” Examples are loss of intellectual property, loss of access credential confidentiality, loss of privacy data, loss of production data.

Each of these three categories have sub categories to further refine and categorize Consequence (16 in total). Consequence is linked to functions, but functions in an OT environment are generally not provided by a single component or even by a single system.

If we consider the process safety function discussed in the TRISIS blog, we see that at minimum this function depends on a field sensor function/asset, an actuator function/asset, a logic solver function/asset together called the safety integrity function (SIF). Additionally there is the HMI engineering function/asset, sometimes a separate HMI operations function / asset, and the channels between these assets.

Still it is a single system with different functions such as: safety integrity function (SIF), alerting function (SIF alerts), a data exchange function, an engineering function, maintenance functions, operation functions and some more functions at detailed level such as diagnostics and sequence of event reporting.

Each of these functions could be targeted by the threat actor as part of the plan, some are more likely than others. All these functions are very well documented, for risk we need to conduct what is called Consequence analysis determining failure modes. A proper understanding of which functional deviations are of interest for a threat actor includes not only an ability to recognize a possible Consequence but also distinguish how functions can fail. These failure modes are basically the 16 sub-categories of the three main categories LRP, LoA, LoC.

The threat actor team will consider what functional deviations are required for the attack and how to achieve this, the defense team should consider what is possible and how to prevent it. If the defense team of the Natanz uranium enrichment plant had conducted Consequence analysis, they would have recognized the potential for causing mechanical stress on the bearings of the centrifuge as the result of functional deviations caused by the variable frequency drive of the centrifuges. Using vibration monitoring would have recognized the change in vibration pattern caused by the small repetitive changes in rotation speed and would almost certainly have caused an earlier alert that something was wrong than the time it took now. The damage (Consequence severity / impact) would have been smaller.

If we jump back to the TRISIS attack we can say that the threat actor’s planned functional deviation (Consequence) could have been the Loss of Ability to execute the safety integrity function, so making the automation function vulnerable if a non-safe situation would occur.

Another scenario described in the TRISIS blog, is the Loss of Required Performance, where the logic function is altered in a way that could cause a flow surge when the process shutdown logic for the compressor would be triggered after having made the change to the logic.

A third Consequence discussed was the Loss of Confidentiality that occurred when the program logic was captured in preparation of the attack.

Every ICS has many functions, I extended the diagram in the PRM blog with some typical functions implemented in a new greenfield plant.

Some typical system functions in a modern plant

Quite a collection of automation functions, and this is just for perhaps a refinery or chemical plant. I leave it to the reader to find the acronyms on the Internet, there you can also value the many solutions and differences there are. The functions for the power grid, for a pipeline, for a pulp and paper mill, oil field, or offshore platform differ significantly. Today’s automation world is a little bit more diverse than SCADA or DCS. I hope the reader realizes that ICS has many functions, different packages, different vendors, many interactions and data exchange. And this is just the automation side of it, for security risk analysis we also need to include the security and system management functions, also these induce risk. Some institutes call this ICS SCADA, I need to stay friendly but really a bad term. The BPCS (Basic Process Control System to give one acronym away for free) can be a DCS or a SCADA, but an ICS is a whole lot more today than DCS or SCADA in the last decade functionality exploded and I guess the promise of IIoT will even grow the number of functions.

Each of the functions in the diagram has a fixed set of for the threat actor interesting deviations (Consequences), these are combined with the threat actions that can cause the deviation (the cyber security hazard), these can be combined with the countermeasures and safeguards / barriers that protect the vulnerabilities and limit the Consequence severity to be able to estimate cyber security risk. resulting in a repository of bow-ties for the various functions.

A cyber security hazop (risk assessment) is not the process of a workshop where a risk analyst threat models the ICS together with the asset owner, that would become a very superficial risk analysis with little value considering the many cyber security hazards there are. Costly in time and scarce in result, a cyber security hazop is the confrontation between a repository of cyber security hazards and the installed ICS functionality, countermeasures, safeguards and barriers.

Consequence plays a key role, because Consequence severity is asset owner specific and depends on the criticality analysis of the systems / functions. Consequence severity can never be higher than the criticality of the system that creates the function. All of this is a process, called Consequence analysis, a process with a series of rules and structured checks that allow estimating cyber security risk (I am not discussing the likelihood part in this blog) and link Consequence to mission impact.


Therefore Consequence with capital C.


Maybe a bit much for a mid-week blog, but I have seen far too many risk assessments where Consequence was not even considered, or expressed in for mitigation meaningless terms as Loss of View and Loss of Control.

Since in automation Consequence is such an essential element we can’t ignore it.

Understanding the hazards, is attempting to understand the devious mind of the threat actor team. Only then we can hope to become pro-active.


There is no relationship between my opinions and publications in this blog and the views of my employer in whatever capacity.


Sinclair Koelemij