When cyber security risk for process automation systems is estimated I often see references made to process safety risk. This has several reasons:
For estimating risk we need likelihood and consequence, the process safety HAZOP and LOPA processes used by plants to estimate process safety risk, identify the consequence of the process scenarios they identify and analyze. These methods also classify the consequence in different categories such as for example finance, process safety, and environment.
People expect a cyber security risk score that is similar to the process safety risk score, a score expressed as loss based risk. The idea is that the cyber threat potentially increases the process safety risk and they like to know how much that risk is increased. Or more precisely how high is the likelihood that the process scenario could occur as result of a cyber attack.
The maturity of the process safety risk estimation method is much higher than the maturity of cyber security risk estimation methods in use. Not that strange if you consider that the LOPA method is about 20 years old, and the HAZOP method goes back to the end sixties. When reading publications, or even the standards on cyber security risk (e.g. IEC 62443-3-2) this lack of maturity is easily detected. Often qualitative methods are selected, however these methods have several drawbacks which I discuss later.
This blog will discuss some of these differences and immaturities. I’ve done this in previous blogs mainly by comparing what the standards say and what I’ve experienced and learned over the past 8 years as a cyber risk analysis practitioner for process automation systems doing a lot of cyber risk analysis for the chemical, and oil and gas industries. This discussion requires some theory, I will use some every day examples to explain to make it more digestible.
Let us start with a very important picture to explain process safety risk and its use, but also to show how process safety risk differs from cyber security risk.
Process safety FN curve
There are various ways to express risk, the two most used are risk matrices and FN plots / FN curve. FN curves require a quantitative risk assessment method, such as used in process safety risk analysis by for example LOPA. In an FN curve we can show the risk criteria. The boundaries for what we consider acceptable risk and what we consider unacceptable risk. I took a diagram that I found on the Internet where we have a number of process safety scenarios (shown as dots on the blue line) their likelihood of occurrence ( the vertical ax) and in this case the consequence expressed in fatalities when such a consequence can happen (horizontal ax). The diagram is taken from a Hydrogen plant, these plants belong to the most dangerous plants, this is why we see the relative high number of scenarios with a single or multiple fatalities.
Process safety needs to meet regulations / laws that are associated with their plant license. One such “rule” is that the likelihood of “in fence” fatalities must be limited to 1 every 1000 years (1.00E-3) If we look at the risk tolerance line (RED) in the diagram we see that what is considered tolerable and intolerable is exactly at the point where the line crosses the 1.00E-03 event frequency (likelihood). Another often used limit is the 1.00E-04 frequency for the limit used as acceptable risk, risk not further addressed.
How does process safety determine this likelihood for a specific process scenario? In process safety we have several structured methods for identifying hazards. One of them is the Hazard and Operability study, in short the HAZOP. In a hazop we analyze, for a specific part of the process, if specific conditions can occur. For example we can take the flow through an industrial furnace and analyze if we can have a high flow, no flow, maybe reverse flow. If such a condition is possible we look at the cause of this (the initiating event), perhaps no flow because a pump fails. If we have established the cause (the initiating event) we consider what would be the process consequence. Well possibly the furnace tubing will be damaged, the feed material would leak into the furnace and an explosion might occur. This is what is called the process consequence. This explosion has an impact on safety, one or multiple field operators might be in the neighborhood and killed by the explosion. There will also be a financial impact, and possibly an environmental impact. A hazop is a multi-month process where a team of specialists goes step by step through all units of the installation and considers all possibilities and ways how to mitigate this hazard. This results in a report with all analysis results documented and classified. Hazops are periodically reviewed in a plant to account for possible changes, this we call the validity period of the analysis.
However we don’t have yet a likelihood expressed as an event frequency such as used in the FN curve. This is where the LOPA method comes in. LOPA has tables for all typical initiating events (causes), so the event frequency for the failure of a pump has a specific value (for example 1E-01, once every 10 years). How were these tables created? Primarily based on statistical experience. These tables have been published, but can also differ between companies. It is not so that a poly propylene factory of company A uses by default the same tables as a poly propylene factory of company B. All use the same principles, but small differences can occur.
In the example we have a failing pump with an initiating frequency of once every 10 years and a process consequence that could result in a single fatality. But we also know that our target for single fatalities should be once per 1000 years or better. So we have to reduce this event frequency of 1E-01 with at least a factor 100 to get to once per 1000 years.
This is why we have protection layers, we are looking for one or more protection layers that offer us a factor one hundred extra protection. One of these protection layers can be the safety system, for example a safety controller that detects the no flow condition by measuring the flow and shuts down the furnace to a safe state using a safety valve. How much “credit” can we take for this shutdown action? This depends on the safety integrity level (SIL) of the safety instrumented function (SIF) we designed. This SIF is more than the safety controller where the logic resides, the SIF includes all components necessary to complete the shutdown function, so will include transmitters that measure the flow and safety valves that close any feed lines and bring other parts of the process into a safe condition.
We assign a SIL to the SIF. We typically (SIL 4 does exist) have 3 safety integrity levels: SIL 1, 2, and 3. According to LOPA a SIL 1 SIF gives us a reduction of a factor 10, SIL 2 will reduce the event frequency by a factor 100, and SIL 3 by a factor 1000.
How do we estimate if a SIF meets the requirements for SIL 1, 2, or 3? This requires us to estimate the average probability of failure on demand for the SIF. This estimation makes use of mean time between failure of the various components of the SIF and the test frequency of these components. For this blog I skip this part of the theory, we don’t have to go into that level of detail. High level we estimate what we call the probability of failure on demand for the protection layer (the SIF). In our example we need a SIF with a SIL 2 rating, a protection level relatively easy to create.
In the FN curve you can also see process scenarios that require more than a factor 100, for example a factor 1000 like in a SIL 3 SIF. This requires a lot more, both from the reliability of the safety controller as well as from the other components. Maybe a single transmitter is not reliable enough anymore and we need some 2oo3 (two out of three) configuration to have a reliable measurement. Never the less the principle is the same, we have some initiating event, we have one or more protection layers capable of reducing the event frequency with a specific factor. These protection layers can be a safety system (like in my example), but also some physical device (e.g. pressure relief valve), an alarm from the control system, an operator action, a periodic preventive maintenance activity, etc. LOPA gives each of these protection layers what is called a credit factor, a factor with which we can reduce the event frequency when the protection layer is present.
So far the theory of process safety risk,. One topic I avoided discussing here is the part where we estimate the probability of failure on demand (PFDavg) for a protection layer. But it has some relevance for cyber risk estimates. If we would go into more detail and discuss these formulas to estimate the effectiveness / reliability of the protection layer we see that the formulas for estimating PFDavg we depend on what is called the demand rate. The demand rate is the frequency which we expect the protection layer will needs to act.
The standard (IEC 61511) makes a difference between what is called low-demand rate and high / continuous demand rate. The LOPA process is based upon the low demand-rate formulas, the tables don’t work for high / continuous demand rate. This is an important point to notice when we start a quantitative cyber risk analysis because the demand rate of a cyber protection layer is by default a high / continuous demand rate type of protection layer. This difference impacts the event frequency scale and as such the likelihood scale. So if we were to estimate cyber risk in a similar manner as we estimated process safety risk we end up with different likelihood scales. I will discuss this later.
A few important points to note from above discussion:
Process safety risk is based on randomly occurring events, events based on things going wrong by accident, such as a pump failure, a leaking seal, an operator error, etc.
The likelihood scale of process safety risk has a “legal” meaning, plants need to meet these requirements. As such a consolidated process safety and cyber security risk score is not relevant and because of estimation differences not even possible.
When we estimate cyber security risk, the process safety risk is only one element. With regard to safety impact the identified safety hazards will most likely be as complete as possible, but the financial impact will not be complete because financial impact might also result from scenarios that do not impact process operations but might impact the business. The process safety hazop or LOPA does not generally address cyber security scenarios for systems that have no potential process impact, for example a historian or metering function.
The IEC 62443 standard tries to introduce the concept of “essential” functions and ties these functions directly to the control and safety functions. However plants and automation functions have many essential tasks not directly related to the control and safety functions, for example various logistic functions. The automation function contains all functions connected to level 0, level 1, level 2, level 3, and demilitarized zone. When we do a risk analysis these systems should be included, not just the control and safety elements. The problem that a ship cannot dock to a jetty also has significant cost to consider in a cyber risk analysis.
Some people suggest that cyber security provides process safety (or worse the wider safety is even suggested.) This is not true, process safety is provided by the safety systems. The various protection layers in place. Cyber security is an important condition for these functions to do their task, but not more as a condition. The Secret Service protects the president of the US against various threats, but it is the president of the US that governs the country – not the Secret Service by enabling the president to do his task.
Where does cyber security risk differ from process safety risk? Well first of all they have different likelihood scales. Process safety risk is based on random events, cyber security risk is based on intentional events.
Then there is the difference that a process safety protection layer always offers full protection when it is executed, many cyber security protection layers don’t. We can implement antivirus as a first protection layer, application white listing as a 2nd protection layer, they both would do their thing but still the attacker can slip through.
Then there is the difference that a cyber security protection layer is almost continually “challenged”, where in process safety the low demand rate is most often applied, which sets the maximum demand rate to once a year.
If we would look toward cyber security risk in the same way as LOPA does toward process safety risk, we could define various events with their initiating event frequency. For example we could suggest an event such as a malware infection to occur bi-annually. We could assign protection layers against this, for example anti-virus and assign this protection layer a probability of failure on demand (risk reduction factor), so a probability on a false negative or false-positive. If we have an initiating event (the malware infection) with a certain frequency and a protection layer (antivirus) with a specific reduction factor we can estimate a mitigated event frequency (of course taking high demand rate into account).
We can also consider multiple protection layers (e.g. antivirus and application white listing) and arrive at a frequency representing the residual risk after applying the two protection layers. Given various risk factors and parameters to enter the system specific elements and given a program that evaluates the hundreds of attack scenarios, we can arrive at a residual risk for one or hundreds of attack scenarios.
Such methods are followed today, not only by the company I work for but also by several other commercial and non-commercial entities. Is it better or worse than a qualitative risk analysis (the alternative)? I personally believe it is better because the method allows to take multiple protection layers into account. Is it actuarial type of risk, no it is not. But the subjectivity of a qualitative assessment has been removed because of the many factors determining the end result and we have risk now as residual risk based upon taking multiple countermeasures into account.
Still there is another difference between process safety and cyber security risk not accounted for. This is the threat actor in combination with his/her intentions. In process safety we don’t have a threat actor, all is accidental. But in cyber security risk we do have a threat actor and this agent is a factor that influences the initiating event frequency of an attack scenario.
The target attractiveness of facilities differ for different threat actors. A nation state threat actor with all its capabilities is not likely to attack the local chocolate cookie factory, but might show interest in an important pipeline. Different threat actors mean different attack scenarios to include but also influence the initiating event frequency it self. Where non-targeted attacks show a certain randomness of occurrence, a targeted attack doesn’t show this randomness.
We might estimate a likelihood for a certain threat actor to achieve a specific objective for the moment that the attack takes place, but this start moment is not necessarily random. Different factors influence this, so to express cyber risk on a similar event frequency scale as process safety risk is not possible. Cyber security risk is not based on the randomness of the event frequencies. If there is a political friction between Russia and Ukraine, the amount of cyber attacks occurring and skills applied is much bigger than in times without such a conflict.
Therefore cyber security risk and process safety risk cannot be compared. Though the cyber threat certainly increases the process safety risk (both initiating event frequency can be higher and the protection layer might not deliver the level of reliability expected), we can not express this rise in process safety risk level because of the differences discussed above. Process safety risk and cyber security risk are two different things and should be approached differently. Cyber security has this “Secret Service” role, and process safety this “US president” role. We can estimate the cyber security risk that this “Secret Service” role will fail and the US government role is made to do bad things, but that is an entirely different risk than that the US government role will fail. It can fail even when the “Secret Service” role is fully active and doing its job. Therefore cyber security risk has no relation with process safety risk, they are two entirely different risks. The safety protection layers provide process safety (resilience against accidental failure), the cyber security protection layers provide resilience against an intentional and malicious cyber attack.
There is no relationship between my opinions and references to publications in this blog and the views of my employer in whatever capacity. This blog is written based on my personal opinion and knowledge build up over 43 years of work in this industry. Approximately half of the time working in engineering these automation systems, and half of the time implementing their networks and securing them, and conducting cyber security risk assessments for process installations since 2012.
This blog is about risk, more precise about a methodology to estimate risk in cyber physical systems. Additionally I discuss some of the hurdles to overcome when estimating risk. It is a method used in both small (< 2000 I/O) and large projects (> 100.000 I/O) with proven success in showing the relationship between different security design options, the cyber security hazards, and the change in residual cyber security risk.
I always thought the knowledge of risk and gambling would go hand in hand, but risk is a surprisingly “recent” discovery. While people gamble thousands of years, Blaise Pascal and Pierre de Fermat developed the risk methodology as recently as 1654. Risk is unique in the sense that it allowed mankind for the first time to make decisions based on forecasting the future using mathematics. Before the risk concept was developed, fate alone decided over the outcome. Through the concept of risk we can occasionally challenge fate.
Since the days of Pascal and De Fermat many other famous mathematicians contributed to the development of the theory around risk. But the basic principles have not changed. Risk estimation, as we use it today, was developed by Frank Knight (1921) a US economist.
Frank Knight defined some basic principles on what he called “risk identification”, I will quote these principles here and discuss them in the context of cyber security risk for cyber physical systems. All mathematical methods today estimating risk still follow these principles. There are some simple alternatives that estimate likelihood (this is generally the difficulty) of an event using some variables that influence likelihood (e.g. using parameters such as availability of information, connectivity, and management) but they never worked very accurate. I start with the simplest of all, principle 1 of the method.
PRINCIPLE 1 – Identify the trigger event
Something initiates the need for identifying risk. This can be to determine the risk of a flood, the risk of a disease, and in our case the risk of an adverse affect on a production process caused by a cyber attack. So the cyber attack on the process control and automation system is what we call the trigger event.
PRINCIPLE 2 – Identify the hazard or opportunity for uncertain gain.
This is a principal formulated in a way typical for an economist. In the world of process control and automation we focus on the hazards of a cyber attack. In OT security a hazard is generally defined as a potential source of harm to a valued asset. A source of discussion is if we define the hazard at automation system level or at process level. Ultimately we of course need the link to the production process to identify the loss event. But for an OT cyber security protection task, mitigating a malware cascading hazard is a more defined task than mitigating a too high reactor temperature hazard would be.
So for me the hazards are the potential changes in the functionality of the process control and automation functions that control the physical process. Or the absence of such a function preventing manual or automated intervention when the physical process develops process deviations. Something I call Loss of Required Performance (performance deviates from design or operations intent) or Loss of Ability to Perform (function is lost, cannot be executed or completed), using the terminology used by the asset integrity discipline.
PRINCIPLE 3 – Identify the specific harm or harms that could result from the hazard or opportunity for uncertain gain.
This is about consequence. Determining the specific harm in a risk situation must always precede an assessment of the likelihood of that harm. If we would start with analyzing the likelihood / probability, we would quickly be asking ourselves questions like “the likelihood of what?” Once the consequence is identified it is easier to identify the probability. In principal a risk analyst needs to identify a specific harm / consequence that can result from a hazard. Likewise the analyst must identify the severity or impact of the consequence. Here starts the first complexity when dealing with OT security risk. In the previous step (PRINCIPLE 2) I already discussed the reason for expressing the hazard initially at control and automation system level to have a meaningful definition I can use to define mitigation controls (Assuming that risk mitigation is the purpose of all this). So for the consequence I do the same I split the consequence of a specific attack on the control and automation system from the consequence for the physical production. When we do this we no longer have what we call a loss event. The consequence for the physical system results in a loss, like no product, or a product with bad quality, or worse perhaps equipment damage or fire and explosion, possibly injured people or casualties, etc.
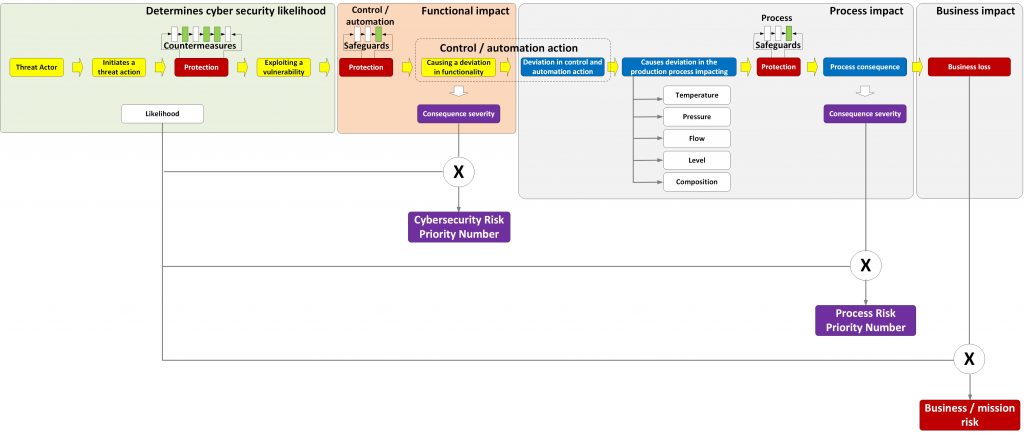
The answer for this is, what is called a risk priority number. A risk priority number is based upon what we call consequence severity (just a value on a scale). Where “true” risk would be based on an impact expressed in terms of loss. A risk priority number can be used for ranking identified hazards, they cannot be used for justifying investments. For justifying investments we need to have a risk value based upon a loss. But this step can be achieved later. Initially I am interested in selecting the security controls that contribute most to reducing the risk for the control and automation system. Convincing business management to invest in these controls is a next step. To explain this, I use the following picture.
Risk process
In the middle of the picture there is the functional impact, the deviation in the functionality of the control and automation system. This functional deviation results in a change (or absence off) the control and automation action. This change will be the cause of a deviation in the physical process. I discuss this part later.
PRINCIPLE 4 – Specify the sequence of events that is necessary for the hazard or opportunity for uncertain gain to result in the identified harm(s).
Before we can estimate the uncertainty, the likelihood / probability, we need to identify the specific sequence of events that is necessary for the hazard to result in the identified consequence. The likelihood of that precise sequence occurring will define the probability of the risk. I can use the word risk here because this likelihood is also the likelihood we need to use for the process risk, because it is the cyber-attack that causes the process deviation and the resulting consequence. (See above diagram)
The problem we face that there are many paths leading to from the hazard to the consequence. We need to identify each relevant pathway. On top of this as cyber security specialists we need to add various hurdles for the threat actors to block them reaching the end of the path, the consequence of the attack. This is where counterfactual risk analysis offers the solution. This new methodology helps us achieve this. The method analysis each possible path, based upon a repository filled with hundreds of potential event paths, and estimates the resulting likelihood of each path. Which is the next topic, PRINCIPLE 5.
PRINCIPLE 5 – Identify the most significant uncertainties in the preceding steps.
We can read the time when this statement was written in the sentence “identifying the most significant uncertainties”. In times before counterfactual analysis we needed to limit the number of paths to analyze. This can lead to and actually did lead to incidents because of missing an event path that was considered insignificant or just not identified (e.g. the Fukushima Daiichi nuclear incident). The more complex the problem, the more event paths exist, the easier we forget one. Today the estimation of likelihood and so risk progressed and is dealt with differently. Considering the complexity of the control and automation systems we have today combined with the abundance of tactics, technologies, and procedures available for the threat actor to attack, the number of paths to analyze is very high. Traditional methods can only cover a limited amount of variations, generally obvious attack scenarios we are familiar with before we start the risk analysis. The result of the traditional methods do not offer the level of detail required. Such a method would spot the hazard of malware cascading risk, the risk that malware propagates through the network. But it is not so important to learn how high malware cascading risk is, it is more important to know if it exists, which assets and channels cause it, and which security zones are affected. This information results from the event paths used in described method.
These questions require a risk estimation with a level of detail missed by the legacy methods. This is specifically very important for OT cyber security, because the number of event paths leading to deviation of a specific control and automation function is much larger than for example the number of event paths identified in process safety hazard analysis. An average sized refinery quickly leads to over 10.000 event paths to analyze.
Still we need “true” risk, risk linked to an actual loss. So far we have determined the likelihood for the event paths, we have grouped these paths to link them to hazards, so we have a likelihood for a hazard and we have a likelihood that a specific consequence can happen. Happily we can consolidate the information at this point, because we need to assign severity. Consequences (functional deviations) can be consolidated in what are called failure modes.
These failure modes result in the deviations in the production process. The plant has conducted a process safety hazop (process hazard analysis for US readers) to identify the event paths for the production system. The hazop identifies for a specific physical deviation (e.g. too high temperature, too high pressure, reverse flow, etc.) what the cause could be of this deviation and what the consequence for the production system is. These process event paths have a relationship with the failure modes / consequences identified by the first part of the risk analysis. A specific cause is can only result from a specific failure mode. We can link the cause to the failure mode and get what is called the extended event path (See diagram above) This provides us with part of the production process consequences. These consequences have an impact, an actual loss to get the mission risk required for justification of cyber security investment.
But the hazop information does not provide all possible event paths because there might be a new malicious combination of causes missed (causes can be combined by an attacker in a single attack to create a bigger impact) and we can attack the safeguards. For example we have the safety instrumented system that implements part of the countermeasures that can become a new source of risk.
The role of the SIS
To explain the role of a SIS, I use above picture to show that OT cyber security has a limited scope within overall process safety (And it would be even more limited if I used the word safety that defines personal safety, process safety, and functional safety). Several of the safeguards specified for the process safety hazard might not be a programmable electronic system and as such not a target for a cyber attack. But some such as the safety instrumented system, or a boiler management system are, so we need to consider them in our analysis and add new extended event paths where required. TRISIS / TRITON showed us SIS is a source of risk.
Since the TRISIS / TRITON cyber attack we need to consider SIS also as a source of new causes most likely not considered in a hazop. The TRISIS/TRITON attack showed us the possibility of modifying the program logic of the logic solver. This can range from simple actions like not closing shutdown valves prior to opening blow down valves and initiating a shutdown action to more complex unit or equipment specific scenarios. Though at operations level we distinguish between manual and automated emergency shutdown, for cyber security we cannot make this difference. Automated shutdown meaning the the shutdown action is triggered by a measured trip level and manual shutdown meaning that the shutdown is triggered by a push button, within the SIS program it is all the same. Once a threat actor is capable of modifying the logic, the difference between manual and automated shutdown disappears and even the highest level of ESD (ESD 0) can be initiated, shutting down the complete plant, potentially with tampered logic.
Consequences caused by cyber attacks so far
If we would look at what would be the ultimate loss resulting from a cyber attack, The “only” loss not caused by a cyber attack are so far fire, explosion, and loss of life. This is not because a cyber attack has not the capability to cause these losses, but we were primarily lucky that some attacks failed. Let’s hope we can keep it that way by adequately analyzing risk and mitigating the residual risk to a level that is acceptable / tolerable.
I don’t want to make the blog too long, but in future blogs I might jump back to some of these principles. There is more to explain on the number of risk levels, how to make risk actionable, etc. If you would unravel the text and add some more detail that I didn’t discuss the used risk method is relatively simple as the next diagram shows.
NORSOK risk model
This model is used by the Norwegian offshore industry for emergency preparedness analysis. A less complex analysis as a cyber security analysis is but that difference is primarily in how the risk picture is established. This picture is from the 2010 version (rev 3) but not that different from the rev 2 version (2001) that is freely available on the Internet. This model is also very similar to ISO 31000 shown in the next diagram.
ISO 31000 risk model
If you read how and where these models are used and how field proven the models are, also in the control and automation world, might explain a bit how surprised I was when I noticed IEC/ISA 62443-3-2 invented a whole new approach with various gaps. New is good when existing methods fail, but if methods exist that meet all requirements for a field proven methodology I think we should use these methods. Plants and engineers don’t benefit from reinventing the wheel. I am adding IEC to the ISA 62443 because last week IEC approved the standard.
I didn’t make this blog to continue the discussion I started in my previous blog, though actually there was no discussion no counter arguments were exchanged – neither did I change my opinion, but to show how risk can / was / is used in projects is important. Specifically because the group of experts doing formal risk assessments is extremely small. Most assessments end up in a short list of potential cyber security risk without identifying the sources of this risk in an accurate manner. In those situations it is difficult understand which countermeasures and safeguards are most effective to mitigate the risk. It also would not provide the level of detail necessary for creating a risk register for managing cyber security based on risk.
There is no relationship between my opinions and references to publications in this blog and the views of my employer in whatever capacity. This blog is written based on my personal opinion and knowledge build up over 42 years of work in this industry. Approximately half of the time working in engineering these automation systems, and half of the time implementing their networks and securing them.
This week’s blog discusses what a Hazard and Operability study (HAZOP) is and some of the challenges (and benefits) it offers when applying the method for OT cyber security risk. I discuss the different methods available, and introduce the concept of counterfactual hazard identification and risk analysis. I will also explain what all of this has to do with the title of the blog, and I will introduce “stage-zero-thinking”, something often ignored but crucial for both assessing risk and protecting Industrial Control Systems (ICS).
What inspired me this week? Well one reason – a response from John Cusimano on last week’s Wake-up call blog.
John’s comment: “I firmly disagree with your statement that ICS cybersecurity risk cannot be assessed in a workshop setting and your approach is to “work with tooling to capture all the possibilities, we categorize consequences and failure modes to assign them a trustworthy severity value meeting the risk criteria of the plant.”. So, you mean to say that you can write software to solve a problem that is “impossible” for people to solve. Hm. Computers can do things faster, true. But generally speaking, you need to program them to do what you want. A well facilitated workshop integrates the knowledge of multiple people, with different skills, backgrounds and experience. Sure, you could write software to document and codify some of their knowledge but, today, you can’t write a program to “think” through these complex topics anymore that you could write a program to author your blogs.”
Not that I disagree with the core of John’s statement, but I do disagree with the role of the computer in risk assessment. LinkedIn is a nice medium, but responses always are a bit incomplete, and briefness isn’t one of my talents. So a blog is the more appropriate place to explain some of the points raised. Why suddenly an abstract? Well this was an idea of a UK blog fan.
I write my blogs not for a specific public, though because of the content, my readers most likely are involved in securing ICS. I don’t think the “general public” public can digest my story easily, so they probably quickly look for other information when my blog lands in their window or they read it till the end and think what was this all about. But there is a space between the OT cyber security specialist, and the general public. I call this space “sales” technical guys but at a distance, and with the thought in mind that “if you know the art of being happy with simple things, then you know the art of having maximum happiness with minimum effort”, I facilitate the members of this space by offering a content filter rule – the abstract.
The process safety HAZOP or Process Hazard Analysis as non-Europeans call the method, was a British invention in the mid-sixties of the previous century. The method accomplished a terrific breakthrough in process safety and made the manufacturing industry a much safer place to work.
How does the method work? To explain this I need to explain some of the terminology I use. A production process, for example a refinery process, is designed creating successive steps of detail. We start with what is called a block flow diagram (BFD), each block represents a single piece of equipment or a complete stage in the process. Block diagrams are useful for showing simple processes or high level descriptions of complex processes.
For complex processes the BFD use is limited to showing the overall process, broken down into its principal stages. Examples of blocks are a furnace, a cooler, a compressor, or a distillation column. When we add more detail on how these blocks connect, the diagram is called a process flow diagram. A process flow diagram (PFD) shows the various product flows in the production process, an example of a PFD is the next text book diagram of a nitric acid process.
Process Flow Diagram. (Source Chemical Engineering Design)
We can see the various blocks in a standardized format. The numbers in the diagram indicate the flows, these are specified in more detail in a separate table for composition, temperature, pressure, … We can group elements in what we call process units, logical groups of equipment that accomplish together a specific process stage. But what we are missing here is the process automation part, what do we measure, how do we control the flow, how do we control pressure? This type of information is documented in what is called a piping and instrument diagram (P&ID).
The P&ID shows the equipment numbers, valves, the line numbers of the pipes, the control loops and instruments with an identification number, pumps, etc. Just like for PFDs we also used use standard symbols in P&IDs to describe what it is, to show the difference between a control valve and a safety valve using different symbols. The symbols for the different types of valves already covers more than a page. If we look at the P&ID of the nitric acid process and zoom into the vaporizer unit we see that more detail is added. Still it is a simplified diagram because the equipment numbers and tag names are removed, alarms have been removed, and there are no safety controls in the diagram.
The vaporizer part of the P&ID (Source Chemical Engineering Design)
On the left of the picture we see a flow loop indicated with FIC (the F from flow, the I from indicator, and the C from control), on the right we see a level control loop indicated with (LIC). We can see which transmitters are used to measure the flow (FT) or the level (LT). We can see the that control valves are used (the rounded top of the symbol). Though above is an incomplete diagram, it shows very well the various elements of a vaporizer unit.
Similar diagrams, different symbols and of course a totally different process, exist for power.
When we engineer a production / automation process P&IDs are always created to describe every element in the automation process. When starting an engineering job in the industry, one of the first things to learn is this “alphabet” of P&ID symbols the communication language for documenting the relation between the automation system (the ICS) and the physical system. For example the FIC loop will be configured in a process controller, there will be “tagnames” assigned to each loop, graphic displays created so the process operator can track what is going on and intervene when needed. Control loops are not configured in a PLC, process controllers and PLCs are different functions and have a different role in an automation process.
So far the introduction for discussing the HAZOP / PHA process. The idea behind a HAZOP is that we want to investigate: What can go wrong; What the consequence of this would be for the production process; And how we can enforce that if it goes wrong the system is “moved” to a safe state (using a safeguard).
There are various analysis methods available, I discuss the classical method because this is similar to what is called a computer HAZOP and like the method John suggests. The one that is really different, counterfactual analysis, and is especially used for complex problems like OT cyber security for ICS I discuss last.
A process safety HAZOP is conducted in a series of workshop sessions with participation of subject matter experts of different disciplines (Operations, safety, maintenance, automation, ..) and led by a HAZOP “leader”, someone not necessarily a subject matter expert on the production process but a specialist in the HAZOP process it self. The results of HAZOPs are as good as the participants and even with very knowledgeable subject matter experts and an inexperienced HAZOP leader results might be bad. Experience is a key factor in the success of a HAZOP.
The inputs for the HAZOP sessions are the PFDs and P&IDs. P&IDs typically represent a process unit but if this is not the case, the HAZOP team selects a part of the P&ID to zoom into. HAZOP discussions focus on process units, equipment and control elements that perform a specific task in the process. Our vaporizer could be a very small unit with a P&ID. The HAZOP team could analyze the various failure modes of the feed flow using what are called “guide words” to guide the analysis in the topics to analyze. Guide words are just a list of topics used to check a specific condition / state. For example there is a guide word High, and another Low, or No, and Reverse. This triggers the HAZOP team to investigate if it is possible to have No flow, is it possible to have High flow, Low flow, Reverse flow, etc. If the team decides that it is possible to have this condition, for example No Flow, they write down the possible causes that can create the condition. What can cause No flow, well perhaps a cause is a valve failure or a pump failure.
When we have the cause we also need to determine the consequence of this “failure mode”, what happens if we have No flow or Reverse flow. If the consequence is not important we can analyze the next, otherwise we need to decide what to do if we have No flow. We certainly can’t keep heating our vaporizer, so if there is no flow so we need to do something (the safeguard).
Perhaps the team decides on creating a safety instrumented function (SIF) that is activated on a low flow value and shuts down the heating of the vaporizer. These are the safeguards, initially high level specified in the process safety sheet but later in the design process detailed. A safeguard can be executed by a safety instrumented system (SIS) using a SIF and are implemented as mechanical devices. Often multiple layers of protection exist, the SIS being only one of them. A cyber security attack can impact the SIS function (modify it, disable it, initiate it), but this is something else as impacting process safety. Process safety typically doesn’t depend on a single protection layer.
Process safety HAZOPs are a long, tedious, and costly process that can take several months to complete for a new plant. And of course if not done in a very disciplined and focused manner, errors can be made. Whenever changes are made in the production process the results need to be reviewed for their process safety impact. For estimating risk a popular method is to use Layers Of Protection Analysis (LOPA). With the LOPA technique, a semi-quantitative method, we can analyze the safeguards and causes and get a likelihood value. I discuss the steps later in the blog when applied for cyber security risk.
Important to understand is that the HAZOP process doesn’t take any form of malicious intent into account, the initiating events (causes) happen accidentally not intentionally. The HAZOP team might investigate what to do when a specific valve fails closed with as consequence No Flow, but will not investigate the possibility that a selected combination of valves fail simultaneously. A combination of malicious failures that might create a whole new scenario not accounted for.
A cyber threat actor (attacker) might have a specific preference on how the valves need to fail to achieve his objective and the threat actor can make them fail as part of the attack. Apart from the cause being initiated by the threat actor, also the safeguards can be manipulated. Perhaps safeguards defined in the form of safety instrumented functions (SIF) executed by a SIS or interlocks and permissives configured in the basic process control system (BPCS). Once the independence of SIS and BPCS is lost the threat actor has many dangerous options available. There are multiple failure scenarios that can be used in a cyber attack that are not considered in the analysis process of the process safety HAZOP. Therefore the need for a separate cyber security HAZOP to detect this gap and address it. But before I discuss the cyber security HAZOP, I will briefly discuss what is called the “Computer HAZOP” and introduce the concept of Stage-Zero-Thinking.
A Computer HAZOP investigates the various failure modes of the ICS components. It looks at the power distribution, operability, processing failures, network, fire, and sometimes at a high level security (can be both physical as well as cyber security). It might consider malware, excessive network traffic, a security breach. Generally very high level, very few details, incomplete. All of this is done using the same method as used for the process safety HAZOP, but the guide words are changed. In a computer HAZOP we work now with guide words such: “Fire”, Power distribution” “Malware infection”, etc. But still document the cause, consequence, and consider safeguards in a similar manner as for the process safety HAZOP. Consequences are specified at high level such as loss of view, loss of control, loss of communications, etc.
At a level we can judge their overall severity but not link it to detailed consequences for the production process. Cyber security analysis at this level would not have foreseen such advanced attack scenarios as used in the Stuxnet attack, it remains at a higher level of attack scenarios. The process operator at the Natanz facility also experienced a “Loss of View”, a very specific one the loss of accurate process data for some very specific process loops. Cyber security attacks can be very granular, requiring more detail than consequences as “Loss of View” and “Loss of Control” offer, for spotting the weak link in the chain and fix it. If we look in detail how an operator HMI function works we soon end up with quite a number of scenarios. The path between the finger tips of an operator typing a new setpoint and the resulting change of the control valve position is a long one with several opportunities to exploit for a threat actor. But while threat modelling the design of the controller during its development many of these “opportunities” have been addressed.
The more complex the number of scenarios we need to analyze the less appropriate the execution of the HAZOP method in the traditional way is because of the time it takes and because of the dependence on subject matter experts. Even the best cyber security subject matter specialists can miss scenarios when it is complex, or don’t know about these scenarios because they don’t have the knowledge of the internal workings of the functions. But before looking at a different, computer supported method, first an introduction of “stage-zero-thinking”.
Stage-zero refers to the ICS kill chain I discussed in an earlier blog where I tried to challenge if an ICS kill chain always has two stages. A stage 1 where the threat actor collects the specific data he needs for preparing an attack on the site’s physical system, and a second stage where actual attack is executed. We have seen these stages in the Trisis / Triton attack , where the threat actors attacked the plant two years before the actual attempt collect information in order to attack a safety controller for modifying the SIS application logic.
What is missing in all descriptions of TRISIS attack so far is stage 0, the stage where the threat actor made his plans to cause a specific impact on the chemical plant. Though the “new” application logic created by the threat actors must be known (part of the malware), it is nowhere discussed what the differences were between the malicious application logic and the existing application logic. This is a missed opportunity because we can learn very much from understanding rational behind the attackers objective. Generally objectives can be reached over multiple paths, fixing the software in the Triconex safety controller might have blocked one path but it is far from certain if all paths leading to the objective are blocked.
For Stuxnet we know the objective thanks to the extensive analysis of Ralph Langner, the objective was manipulation of the centrifuge speed to cause excessive wear of the bearings. It is important to understand the failure mode (functional deviation) used because this helps us to detect it or prevent it. For the attack on the Ukraine power grid, the objective was clear … causing a power outage .. the functional deviation was partially unauthorized operation of the breaker switches and partially the corruption of protocol converter firmware to prevent the operator to remotely correct the action. This knowledge provides us with several options to improve the defense. Another attack, the attack on the German Steel mill the actual method used is not known. They gained access using a phishing attack but in what way the attacker caused the uncontrolled shutdown is never published. The objective is clear but the path to it not, so we are missing potential ways to prevent it in future. Just preventing unauthorized access is only blocking one path, it might still be possible to use malware to do the same. In risk analysis we call this the event path, the longer we oversee this event path the stronger our defense can be.
Attacks on cyber physical systems have a specific objective, some are very simple (like the ransomware objective) some are more complex to achieve like the Stuxnet objective or in power the Aurora objective. Stage-zero-thinking is understanding which functional deviations in the ICS are required to cause the intended loss on the physical side. The threat actor starts at the end of the attack and plans an event path in the reverse direction. For a proper defense the blue team, the defenders, needs to think like the red team. If they don’t they will always be reactive and often too late.
The first consideration of the Stuxnet threat actor team must have been how to impact the uranium enrichment plant to stop doing what ever they were doing. Since this was a nation state level attack there were of course kinetic options, but they selected the cyber option with all consequences for the threat landscape of today. Next they must have been studying the production process and puzzling how to sabotage it. In the end they decided that the centrifuges were an attractive target, time consuming to replace and effectively reducing the plant’s capacity. Than they must have considered the different ways to do this, and decided on making changes in the frequency converter to cause the speed variations responsible for the wear of the bearings. Starting at the frequency converter they must have worked their way back toward how to modify the PLC code, how to hide the resulting speed variations from the process operator, etc, etc. A chain of events on this long event path.
in the scenario I discussed in my Trisis blog I created the hypothetical damage through modifying a compressor shutdown function and subsequently initiating a shutdown causing a pressure surge that would damage the compressor. Others suggested the objective was a combined attack on the control function and process safety function. All possible scenarios, the answer is in the SIS program logic not revealed. So no lesson learned to improve our protection.
My point here is that when analyzing attacks on cyber physical systems we need to include the analysis of the “action” part. We need to try extending the functional deviation to the process equipment. For many process equipment we know the dangerous failure modes, but we should not reveal them if we can learn from them to improve the protection. This because OT cyber security is not limited to implementing countermeasures but includes considering safeguards. In IT security, there is a focus on the data part for example: the capturing of access credentials; credit card numbers; etc.
In OT security need to understand the action, the relevant failure modes. As explained in prior blogs, these actions are in the two categories I have mentioned several times: Loss of Required Performance (deviating from design or operations intent) and Loss of Ability to Perform (the function is not available). I know that many people like to hang on to the CIA or AIC triad, or want to extend, the key element in OT cyber security are these functional deviations that cause the process failures to address these on both the likelihood and impact factors we need to consider the function and than CIA or AIC is not very useful. The definitions used by the asset integrity discipline offer us far more.
Both loss of required performance and loss of ability to perform are equally important. Causing the failure modes linked to loss of required performance the threat actor can initiate the functional deviation that is required to impact the physical system, with failure modes associated with the loss of ability to perform the threat actor can prevent detection and / or correction of a functional deviation or deviation in the physical state of the production process.
The level of importance is linked to loss and both categories can cause this loss, it is not that Loss of Performance (kind of equivalent of the IT integrity term) or Loss of Ability to Perform (The IT availability term) cause different levels of loss. The level of loss depends on how the attacker uses these failure modes to cause the loss, a loss of ability can easily result in a runaway reaction without the need of manipulation of the process function, some production processes are intrinsically unstable.
All we can say is that loss of confidentiality is in general the least important loss if we consider sabotage, but can of course lead to enabling the other two if it concerns confidential access credentials or design information.
Let’s leave the stage-zero-thinking for a moment and discuss the use of the HAZOP / PHA technique for OT cyber security.
I mentioned it in previous blogs, a cyber attack scenario can be defined as:
A THREAT ACTOR initiates a THREAT ACTION exploiting a VULNERABILITY to achieve a certain CONSEQUENCE.
This we can call an event path, a sequence of actions to achieve a specific objective. A threat actor can chain event paths, for example in the initial event path he can conduct a phishing attack to capture login credentials, followed-up by an event path accessing the ICS and causing an uncontrolled shut down of a blast furnace. The scenario discussed in the blog on the German steel mill attack. I extend this concept in the following picture by adding controls detailing the consequence.
Event path
In order to walk the event path a threat actor has to overcome several hurdles, the protective controls used by the defense team to reduce the risk. There are countermeasures acting on the likelihood side (for instance firewalls, antivirus, application white listing, etc.) and we have safeguards / barriers acting on the consequence side to reduce consequence severity by blocking consequences to happen or detect them in time to respond.
In principal we can evaluate risk for event paths if we assign an initiating event frequency to the threat event, have a method to “measure” risk reduction, and have a value for consequence severity. The method to do this is equivalent to the method used in process safety Layer Of Protection Analysis (LOPA).
In LOPA the risk reduction is among others a factor of the probability of demand (PFD) factor we assign to each safeguard, there are tables that provide the values, the “credit” we take for implementing them. The multiplication of safeguard PFDs in the successive protection layers provides a risk reduction factor (RRF). If multiplied with the initiating event frequency we get the mitigated event frequency (MEF). We can have multiple layers of protection allowing us to reduce the risk. The inverse of the MEF is representative for the likelihood and we can use it for the calculation of residual risk. In OT cyber security the risk estimation method is similar, also here we can benefit from multiple protection layers. But maybe in a future blog more detail on how this is done and how detection comes into the picture to get a consistent and repeatable manner for deriving the likelihood factor.
To prevent questions, I probably already explained in a previous blog, but for risk we have multiple estimation methods. We can use risk to predict an event to happen, this is called temporal risk, we need statistical information to get a likelihood. We might get this one day if we have every day an attack on ICS, but today there is not enough statistical data for ICS cyber attacks to estimate temporal risk. So we need another approach, and this is what is called a risk priority number.
Risk priority numbers allow us to rank risk, we can’t predict but we can show which risk is more important than another and we can indicate which hazard is more likely to occur than another. This is done by creating a formula to estimate the likelihood of the event path to reach its destination, the consequence.
If we have sufficient independent variables to score for likelihood, we get a reliable difference in likelihood between different event paths.
So it is far from the very subjective assignment method of a likelihood factor by a subject matter expert as explained by a NIST risk specialist in a recent presentation organized by the ICSJWG. Such a method would lead to a very subjective result. But enough about estimating risk this is not the topic today, it is about the principles used.
Counterfactual hazard identification and risk analysis is the method we can use for assessing OT cyber security risk in a high level of detail. Based on John Cusimano’s reaction it looks like an unknown approach. Though the method is at least 10+ years in every proper book on risk analysis and in use. So what is it?
I explained the concept of the event path in the diagram, counterfactual risk analysis (CRA) is not much more than building a large repository with as many event paths as we can think of and then processing them in a specific way.
How do we get these event paths? One way is to study the activities of our “colleagues” working in threat_community inc. They potentially learn us in each attack they execute one or more new event paths. Another way to add event paths is by threat modelling, at least than we become proactive. Since cyber security also entered the development processes of ICS in a much more formal manner, many new products today are being threat modeled. We can benefit of those results. And finally we can threat model ourselves at system level, the various protocols (channels) in use, the network equipment, the computer platforms.
Does such a repository cover all threats, absolutely not but if we do this for a while with a large team of subject matter experts in many projects the repository of event paths grows very quickly. Learning curves become very steep in large expert communities.
How does CRA make use of such a repository? I made a simplified diagram to explain.
The Threat Actor (A) that wants to reach a certain consequence / objective (O), has 4 Threat Actions (TA) at his disposal. Based on A’s capabilities he can execute one or more. Maybe a threat actor with IEC 62443 SL 2 capabilities can only execute 1 threat action, while an SL 3 has the capabilities to execute all threat actions. The threat action attempts to exploit a Vulnerability (V), however sometimes the vulnerability is protected with a countermeasure(s) (C). On the event path the threat actor needs to overcome multiple countermeasures if we have defense in depth, and he needs to overcome safeguards. Based on which countermeasures and safeguards are in place event paths are yes or no available to reach the objective, for example a functional deviation / failure mode. We can assign a severity level to these failure modes (HIGH, MEDIUM, etc)
In a risk assessment the countermeasures are always considered perfect, there reliability, effectiveness and detection efficiency is included in their PFD. In a threat risk assessment, where also a vulnerability assessment is executed, it becomes possible to account for countermeasure flaws. The risk reduction factor for a firewall that starts with the rule permit any any will certainly not score high on risk reduction.
I think it is clear that if we have an ICS with many different functions (so different functional deviations / consequences, looking at the detailed functionality), different assets executing these functions, many different protocols with their vulnerabilities, operating systems with their vulnerabilities, and different threat actors with different capabilities, the number of event paths grows quickly.
To process this information a CRA hazard analysis tool is required. A tool that creates a risk model for the functions and their event paths in the target ICS. A tool takes the countermeasures and safeguards implemented in the ICS into account, a tool that accounts for the static and dynamic exposure of vulnerabilities, and a tool that accounts for the severity of the consequences. If we combine this with the risk criteria defining the risk appetite / risk tolerance we can estimate risk and can quickly show which hazards have an acceptable risk, tolerable risk, or unacceptable risk.
So a CRA tool builds the risk model through configuring the site specific factors, for the attacks it relies on the repository of event paths. Based on the site specific factors some event paths are impossible, others might be possible with various degrees of risk. More over such a CRA tool makes it possible to show additional risk reduction by enabling more countermeasures. Various risk groupings become possible, for example it becomes possible to estimate risk for the whole ICS if we take the difference in criticality between the functions into account. We might want to group malware related risk by filtering on threat actions based on malware attacks or other combinations of threat actions.
Such a tool can differentiate risk for each threat actor with a defined set of TTP. So it becomes possible to compare SL 2 threat actor risk with SL 3 threat actor risk. Once we have a CRA model many points of view become available, could even see risk vary for the same configuration if the repository grows.
So there is a choice, either a csHAZOP process with a workshop where the subject matter experts discuss the various threats. Or using a CRA approach where the workshop is used to conduct a criticality assessment, consequence analysis, and determine the risk criteria. It is my opinion that the CRA approach offers more value.
So finally what has this all to do with the title “playing chess on the ICS board”? Well apart from a OT security professional I was also a chess player, playing chess in times there was no computer capable of playing a good game.
The Dutch former world champion Max Euwe (also professor Informatics) was of the opinion that computers can’t play chess at a level to beat the strongest human chess players. He thought human ingenuity can’t be put in a machine, this is about 50 years ago.
However large sums of money were invested in developing game theory and programs to show that computers computers can beat humans. The first time that this happened was when an IBM computer program “Deep Blue” won from then reigning world champion Gary Kasparov in 1997. The computers approached the problem brute force in those days, generating for each position all the possible moves, analyzing the position after the move and going to the next level for a new move for the move or moves that scored best. Computers could do this so efficiently that looked 20/30 moves (plies) ahead, far more than any human could do. Humans had to use their better understanding of the position and its weaknesses and defensive capabilities.
But the deeper a computer could look and the better its assessment of the position became the stronger it became. And twenty years ago it was quite normal that machines could beat humans at chess, including the strongest players. This was the time that chess games could not be adjourned anymore because a computer could analyse the position. Computers were used by all top players to check their analysis in the preparation of games, it considerably changed the way chess was played.
Than recently we had the next generation based on AI (E.g. Alpha Zero) and again the AI machines proofed stronger, stronger then the machines making use of the brute force method. But these AI machines offered more, the additional step was that humans started to learn from the machine. The loss was no longer caused by our brains not being able to analyze so many variations, but the computer actually understood the position better. Based upon all the games played by people the computers recognized patterns that were successful and patterns that would ultimately lead to failure. Plans that were considered very dubious by humans were suddenly shown to be very good. So grandmasters learned and adopted this new knowledge even by today’s world champion Magnus Carlsen.
So contrary John’s claim if we are able to model the problem we create a path where computers can conquer complex problems and ultimately be better than us.
CRA is not brute force – randomly generating threat paths – but processing the combined knowledge of OT security specialists with detailed knowledge of the inner workings of the ICS functions contained in a repository. Kind of the patterns recognized by the AI computer.
CRA is not making chess moves on a chess board, but verifying if an event path to a consequence (Functional deviation / failure mode) is available. An event path is a kind of move, it is a plan to a profitable consequence.
Today CRA uses a repository made and maintained by humans, but I don’t exclude it that tomorrow AI assisting us to consider which threats might work and which not. Maybe science fiction, but I saw it happen with chess, Go, and many other games. Once you model a problem computers have proofed to be great assistants and even proofed to be better than humans. CRA exists today, an AI based CRA may exist tomorrow.
So in my opinion the HAZOP method in the form applied to process safety and in computer HAZOPs leads to a generalization of the threats when applied for cyber security because of the complexity of the analysis. Generalization leads to results comparable with security standard-based or security-compliance-based strategies. For some problems we just don’t need risk, if I cross a street I don’t have to estimate the risk. Crossing in a straight line – shortest path – will reduce the risk. The risk would be mainly how busy the road is.
For achieving the benefits of a risk based approach in OT cyber security we need tooling to process all the hazards (event paths) identified by threat modelling. The more event paths we have in our brain, the repository, the more value the analysis produces. Counter fact risk analysis is the perfect solution for achieving this, it provides a consistent detailed result allowing for looking at risk from many different viewpoints. So computer applications offer significant value, by offering a more in depth analysis, for risk analysis if we apply the right risk methodology.
There is no relationship between my opinions and references to publications in this blog and the views of my employer in whatever capacity. This blog is written based on my personal opinion and knowledge build up over 42 years of work in this industry. Approximately half of the time working in engineering these automation systems, and half of the time implementing their networks and securing them.